Climate indices (CIs) can be a long-range forecaster’s best friend. The atmosphere is a very complex system and even though we have dynamical models to predict weather and climate, there is a tremendous amount of data that needs to be processed in order to prepare a forecast.
Climate indices help reduce the complexity of the atmosphere to single numbers that can describe characteristic behaviors of the atmosphere. In this article we consider which of the climate indices are useful in the subseasonal timeframe, and which are more relevant in the seasonal range.
Subseasonal and Seasonal Climate Indices: Definition
Climate indices are designed to describe the state of the atmosphere or sea surface temperature and their variation. Climate index values can persist from days to years, which makes them excellent tools for long-range weather forecasting. Climate indices also provide a convenient way to describe weather patterns over large areas.

Subseasonal and Seasonal Climate Indices: Persistence
Climate indices describe atmospheric or oceanic conditions that typically oscillate between two or more states. Each index is associated with characteristic weather conditions that are generally dependent on location and time of year.
Although understanding the weather conditions associated with a particular index is helpful, the utility of climate indices also depends on their persistence– which is the number one difference between subseasonal and seasonal CIs.
Climate indices that are moderately persistent, meaning the weather pattern associated with a specific index evolves over periods of days to week, are generally associated with lower atmospheric pressure patterns and processes.
Climate indices with only moderate persistence are best used for subseasonal forecasting because the phenomena they describe becomes swamped by other factors in a few, to several weeks, ahead.
Climate indices that are highly persistent, meaning the weather pattern evolves slowly over months or even years, are generally associated with sea surface temperatures (SSTs), or upper atmospheric phenomena.
Climate indices with long-term persistence are ideally suited to seasonal forecasting as they remain influential for extended periods of time.
Subseasonal and Seasonal Climate Indices: Subseasonal
The following CIs represent lower atmospheric pressure patterns and processes, and are useful in the subseasonal range;
- Arctic Oscillation (AO)
- Southern Annular Mode (SAM) or Antarctic Oscillation (AAO)
- North Atlantic Oscillation (NAO)
- Pacific North America pattern (PNA)
- Eastern Pacific Oscillation (EPO)
- Western Pacific Oscillation (WPO)
- Scandinavian Pattern (SCAND)
- East Atlantic / Western Russia pattern (EA/WR)
- Southern Oscillation Index (SOI)
- Madden-Julian Oscillation (MJO)
Each of these climate indices are features of the lower atmosphere with phases that persist for several days to one or two weeks. Dynamical models are usually able to predict these CIs well in the medium range. Indications beyond the medium range (two weeks) ahead are generally weak, but we often find useful signals in the subseasonal range too.
The Most Influential Subseasonal Climate Index
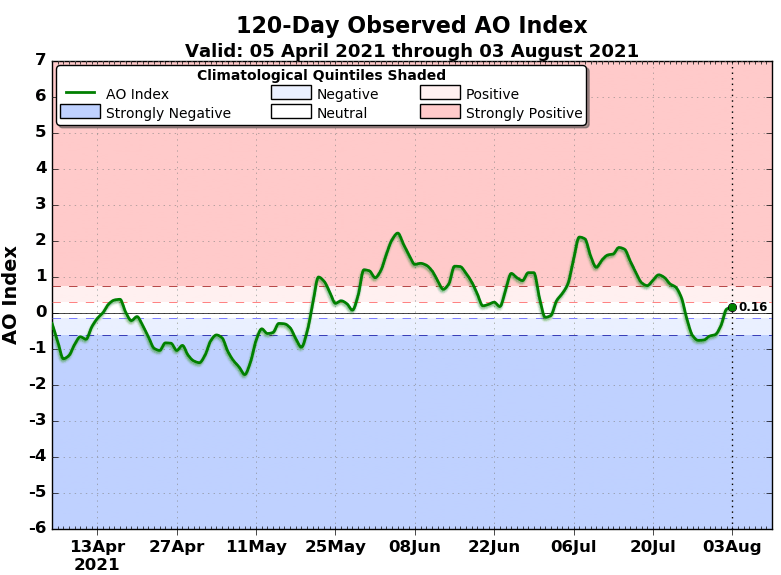
All of the climate indices can have important weather impacts in their own backyard, but perhaps the most influential and far-reaching of the subseasonal climate indices is the Arctic Oscillation. The AO describes the atmospheric pressure anomaly over the Arctic region. This in turn determines the characteristics of the tropospheric polar jet which shapes the weather across mid-latitudes right the way around the Northern Hemisphere.
The phase of the wintertime AO (Figure 1) is a crucial factor in determining the weather across North America, Europe and Asia. When the AO is positive, much of the mid-latitudes enjoy mild winter weather, whereas a negative AO can bring a chill to China, frosts to France, and blizzards to Buffalo.
Did you know? The Southern Annular Mode (SAM), or Antarctic Oscillation (AAO), is the lesser-known twin to the Arctic Oscillation. It is essentially the same phenomenon as the AO but it occurs over the Antarctic region during the Southern Hemisphere winter.
The Most Unusual Subseasonal Climate Index
Subseasonal climate indices generally relate to a fixed region of the globe, but did you know that one of these subseasonal climate indices is not like the others? Kudos if you said Madden-Julian Oscillation.
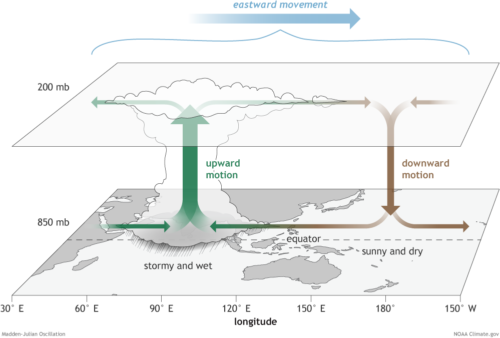
Unlike all of the other subseasonal climate indices, the MJO (Figure 2) plays out in the tropics all around the globe. The MJO climate index describes the position and strength of an intermittent area of enhanced tropical convection.
When the MJO is active, an atmospheric wave moves west to east through the tropics, first suppressing, then boosting any shower activity that lies in its path. When the MJO is active, it typically advances around the whole globe within 40 to 50 days, which is why it is very much a subseasonal phenomenon.
Subseasonal and Seasonal Climate Indices: Seasonal
The following sea surface temperature climate indices are useful in the seasonal range;
- El Niño Southern Oscillation (ENSO)
- Southern Oscillation Index (SOI)
- Atlantic Multi-decadal Oscillation (AMO)
- Indian Ocean Dipole (IOD)
- North Pacific Mode (NPM)
- Pacific Decadal Oscillation (PDO)
There are also two little-known upper atmospheric climate indices;
- Quasi-Biennial Oscillation (QBO)
- Stratospheric Polar Vortex (SPV)
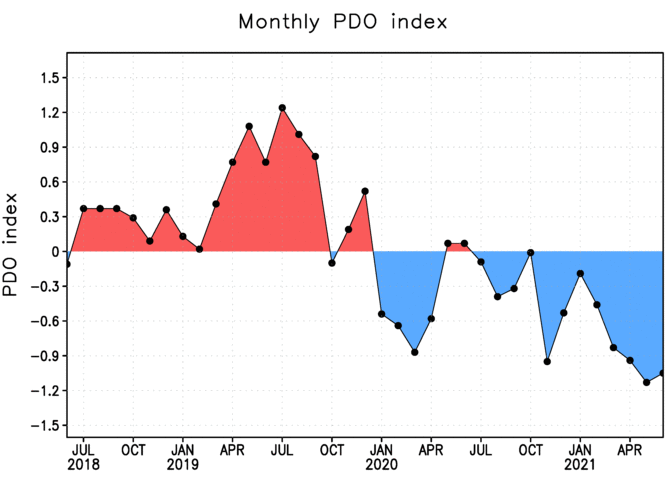
The phase, and thus influence on the weather, of each of these climate indices can persist for many months (Figure 3). Dynamical models are usually able to predict these climate indices well in the seasonal range.
The Most Influential Seasonal Climate Index
Of all Earth’s climate indices there can be no doubt that the El Niño/Southern Oscillation is king. ENSO dominates the largest ocean on the planet and influences one of the largest atmospheric circulations: the Walker Cell.
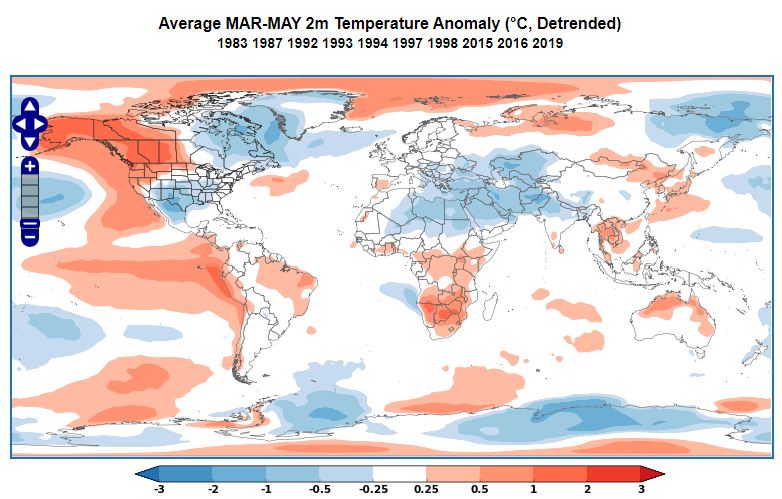
The weather impacts from the ENSO cycle are not only felt in the immediate vicinity of the Pacific Ocean, but also much farther afield across the subtropics and even the mid-latitudes of North America, Europe, and Asia (Figure 4).

The Most Unusual Seasonal Climate Index
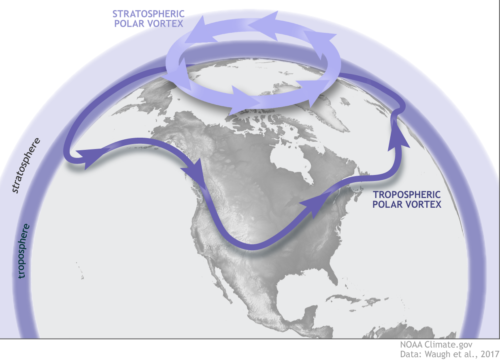
The candidates for most unusual seasonal climate indices must surely be our two stratospheric phenomena: the Quasi-Biennial Oscillation, and the stratospheric polar vortex. Who would have thought that what happens eight to 30 miles above the Earth (Figure 5) could influence the weather down here on the ground?
Not only is the stratosphere a great distance away, but there is not much there – it’s pretty empty. The stratosphere contains only 10 percent of the Earth’s air, and there is virtually no water, which means no cloud, and no precipitation.
The accolade of the Most Unusual Seasonal Climate Index goes to the stratospheric polar vortex. The influence of the SPV persists just about long enough for it to qualify as a seasonal climate index. It forms above the Arctic at the start of the Northern Hemisphere winter, and dissipates in the spring.
It is usually very stable, and so we can count on it staying either strong or weak from a few weeks, to a month or two, ahead. Once in every two winters on average, the SPV collapses suddenly, and when it does so, it can change the weather patterns across large parts of the northern mid-latitudes as far as 90 days into the future.
Subseasonal and Seasonal Climate Indices: Conclusion
The #1 difference between Subseasonal and Seasonal Climate Indices is persistence. Climate indices that persist from days to a week or two are useful in the subseasonal time frame, whereas climate indices that persist from months to years are valuable at seasonal lead times.
The World Climate Service has developed a powerful data mining system which enables users to instantly see the impacts of any of the major climate indices at various times of the year in various parts of the world. Most importantly, having access to this information allows long-range forecasters to save time, manage climate risks, and create climate related opportunities.