The children of Chicago did not know the cause, but the signature of the Eastern Pacific oscillation created a very cold Halloween for them in 2019. The Eastern Pacific Oscillation index had dipped deeply into negative territory and was impacting temperatures from Alaska to Chicago, Illinois. See how the Alaskan Ridge weather regime best matches with a negative Eastern Pacific Oscillation here!
In this article, we investigate the Eastern Pacific Oscillation (often referred to as simply the EPO): what it is, how it impacts the weather, and how we can use it in long-range forecasting.
What is the Eastern Pacific Oscillation (EPO)?
The Eastern Pacific Oscillation is one of many cyclic phenomena (or teleconnections) that describe the atmospheric flow pattern over the Northeast Pacific sector. The EPO can shape the weather across North America with characteristic patterns in evidence at different times of the year. The EPO is a near-neighbor of the Western Pacific Oscillation. Check out and click on the Eastern Pacific Oscillation (EPO) quick summary PDFs for the:
What is the Current Value of the Eastern Pacific Oscillation (EPO)?
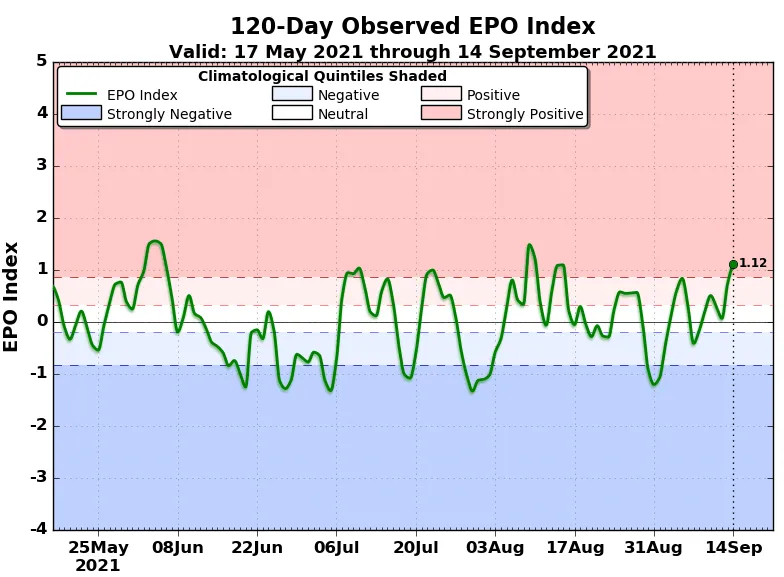
The current value of the EPO is shown in Figure 2.
The Positive Phase of the Eastern Pacific Oscillation
The EPO is largely driven by the pressure pattern over Alaska, which forms a dipole with the pressure over the Pacific northeast of Hawaii. Figure 3 shows a positive EPO occurs when low pressure is resident over Alaska and high pressure is northeast of Hawaii. Downstream over the US we see ridging across the East and California, with troughing over the Central and Northwestern US. See how the Pacific Trough weather regime best matches with a positive Eastern Pacific Oscillation here!
The World Climate Service has developed a powerful data mining system that enables users to quickly explore the impact of the Quasi-Biennial Oscillation, and many other indices, by phase for each month of the year, showing impacts on all the major weather variables all around the globe. The maps featured in this article can be produced in just a few clicks of the mouse.
A positive EPO in summer (Figure 4) displays a similar set up to the winter pattern over the Pacific, but we do see a different pattern over the lower 48 states. A positive EPO in summer is associated with troughing over the Gulf States and a slight preference for ridging across the Great Lakes, Rockies and California.
Impact 1: EPO Positive Phase in Winter
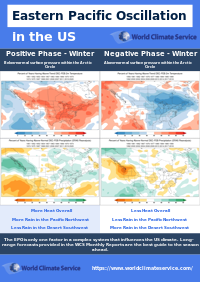
During the positive phase of the EPO in the wintertime, much of the lower 48 states are likely to be warmer than normal, but California and the Southwest deserts are usually cooler than normal (Figure 5).
At the same time, the Pacific Northwest, the East and much of the Midwest are likely to be wetter than normal. The positive EPO usually brings relatively dry winters to the Southwest and the Upper Midwest (Figure 6).
Impact 2: EPO Positive Phase in Summer
When the summer EPO is positive there is a bias towards warmer than normal, especially across the northern states (Figure 7). The Pacific Northwest and Texas are most likely to see cool summers when the EPO is positive.
The summer monsoon across the Southwestern deserts tends to be wetter than normal during a positive EPO (Figure 8). The mid-Atlantic and the Northeast also tend to have wet summers. The positive EPO usually brings a dry summer to the Northwest, the Midwest and the Southeast.
The Negative Phase of the Eastern Pacific Oscillation
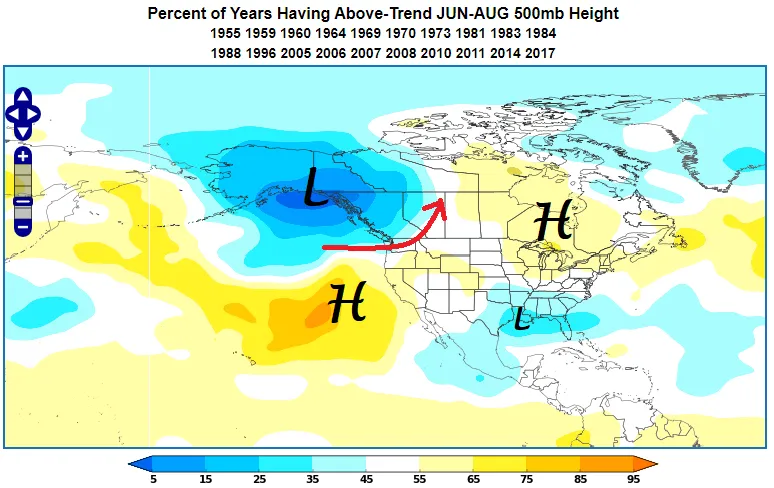
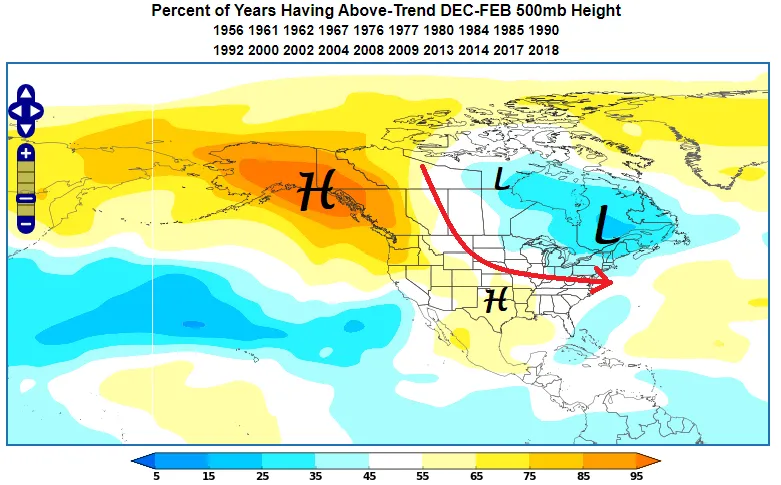
The negative phase of the EPO is essentially a mirror image of the positive phase, with high pressure centred on Alaska and low pressure towards Hawaii (Figure 9). We usually see ridging stretching from the Pacific Northwest to Texas, but also troughing over the Northeastern US.
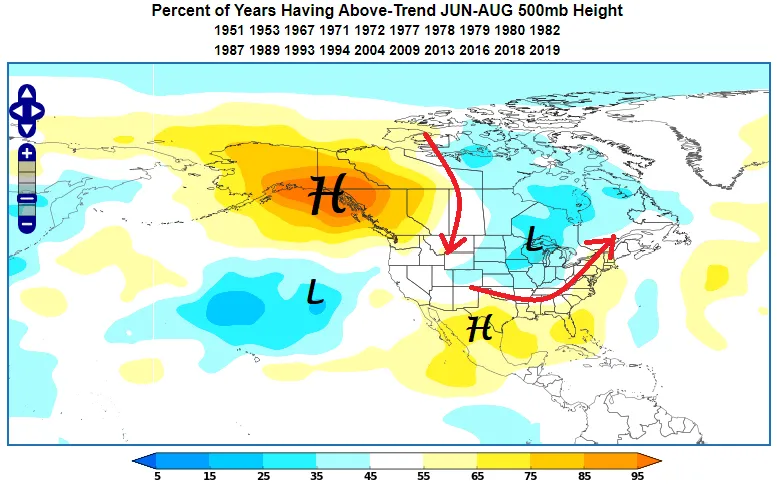
In the summer there is a slight preference for ridging in the South and East, but troughing is typical over the Midwest (Figure 10).
Impact 3: EPO Negative Phase in Winter
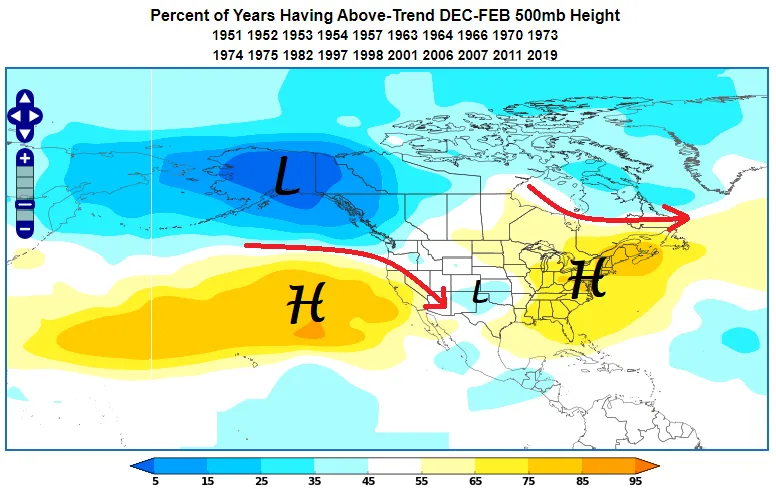
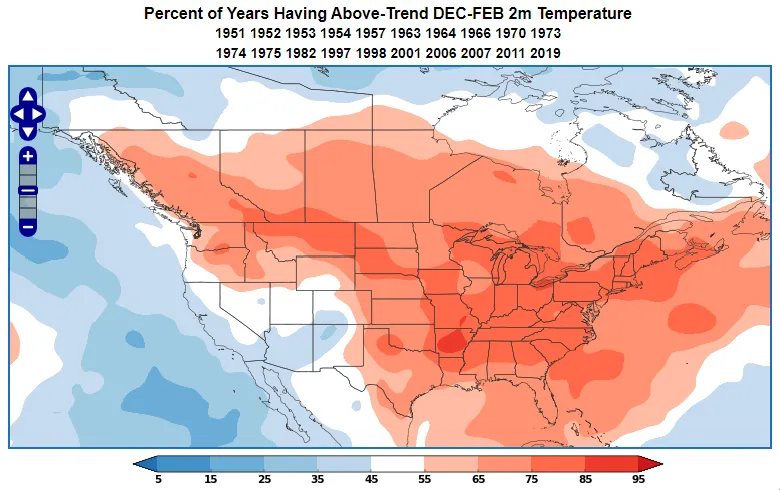
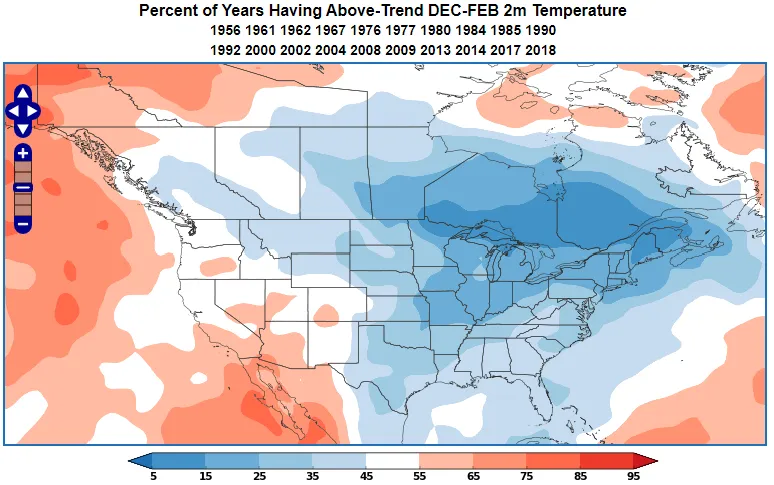
During the negative phase of the EPO in wintertime, the Central and Eastern US is more likely to see below normal temperatures, with above normal temperatures more likely in the West and particularly the Southwest (Figure 11).
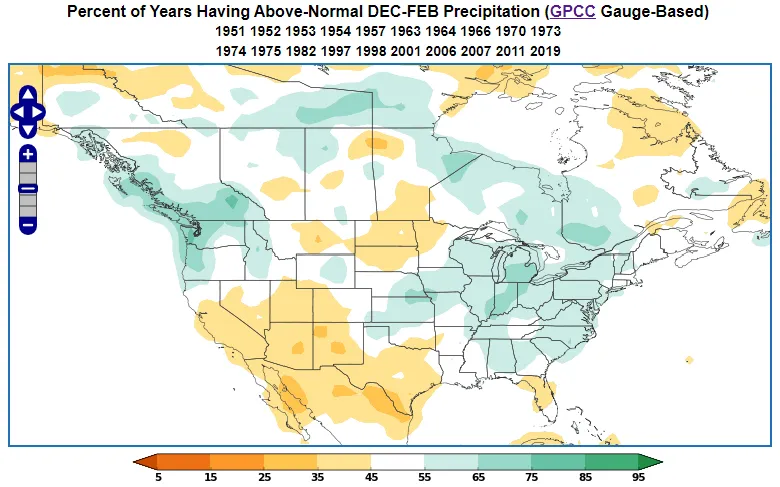
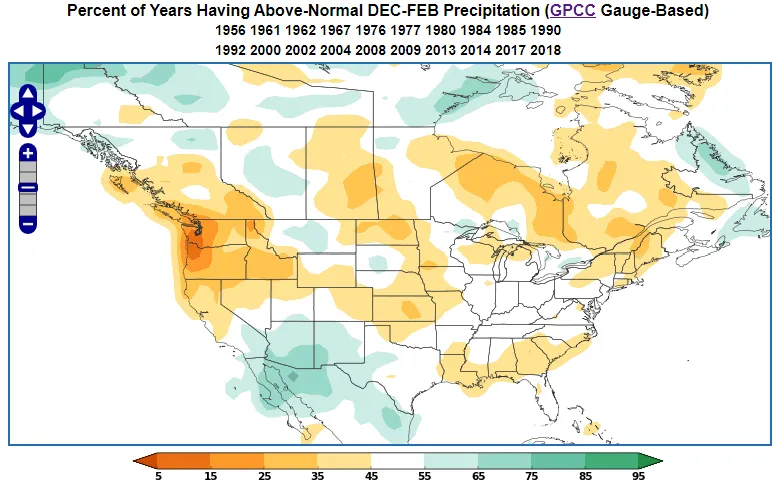
At the same time, the Pacific Northwest is very likely to be drier than normal. Some central and eastern areas are also likely to collect less rainfall than normal. The wettest spot during a negative EPO winter is the Southwest (Figure 12).
Impact 4: EPO Negative Phase in Summer
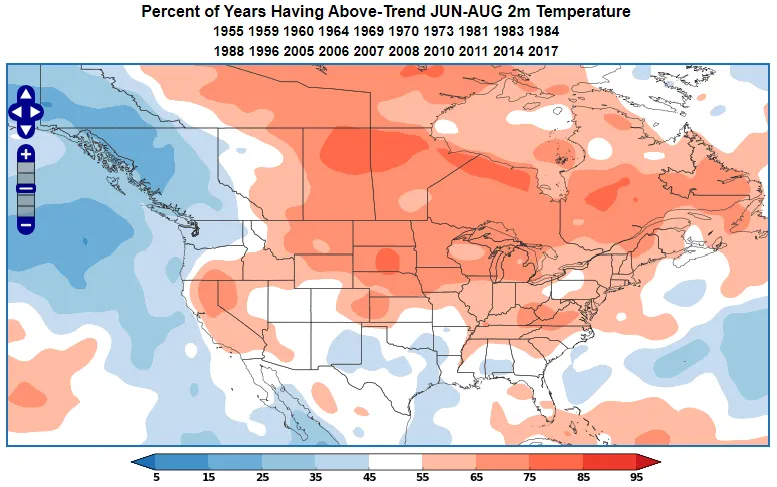
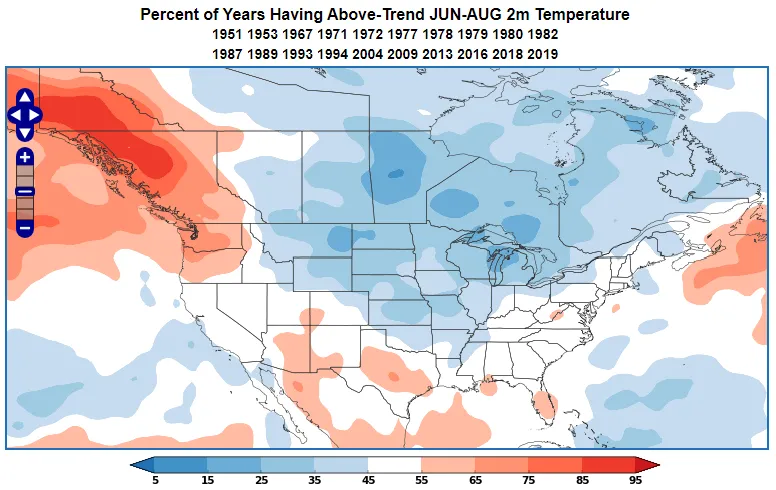
In summertime when the EPO is negative, we see cooler than normal weather across the Midwest and the Plains. At the same time, we are more likely to see above normal temperatures across Texas and the Pacific Northwest (Figure 13).
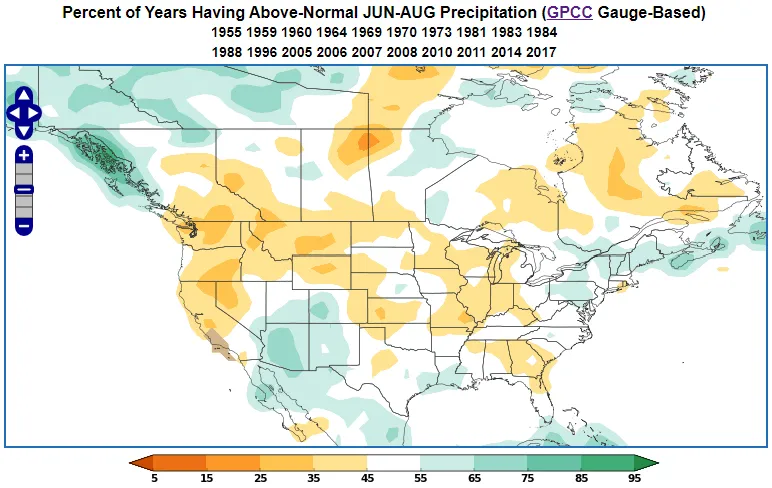
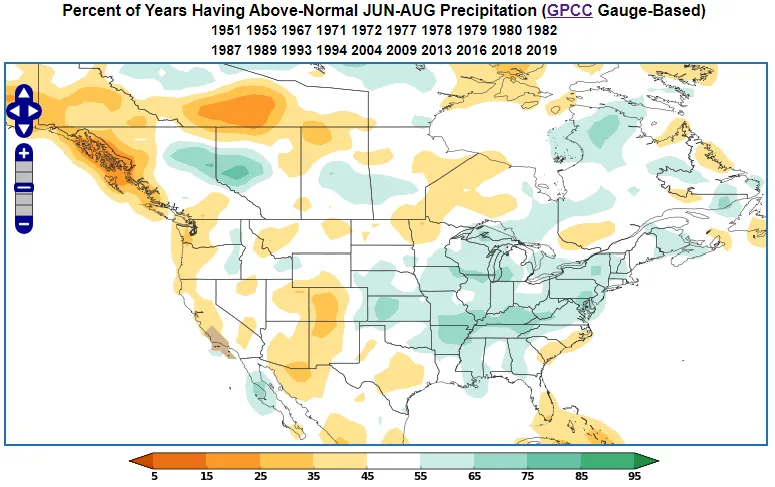
The negative Eastern Pacific Oscillation in summer is likely to bring anomalous rainfall to the Midwest and the Mid-Atlantic, while the West and Southwest is liable to be drier than normal (Figure 14).
Long Range Forecasting and the Eastern Pacific Oscillation
The Eastern Pacific Oscillation typically remains in a given phase anywhere from a few days to a few weeks. One of the reasons that the EPO has high variability is that it is modulated by the tropical Madden-Julian Oscillation, which has an irregular 42-day cycle.
Thus the EPO is very much a subseasonal climate phenomenon (as opposed to a longer-lasting seasonal climate cycles such as ENSO and the SOI). Occasionally the subseasonal models will latch on to a high probability of one phase or the other with a two- or three-week lead time. If there is cross-model support, then a long-range forecaster can start to think about what typically happens for that phase of the EPO at this time of year. Fortunately, the World Climate Service provides the forecaster with the tools to do so.
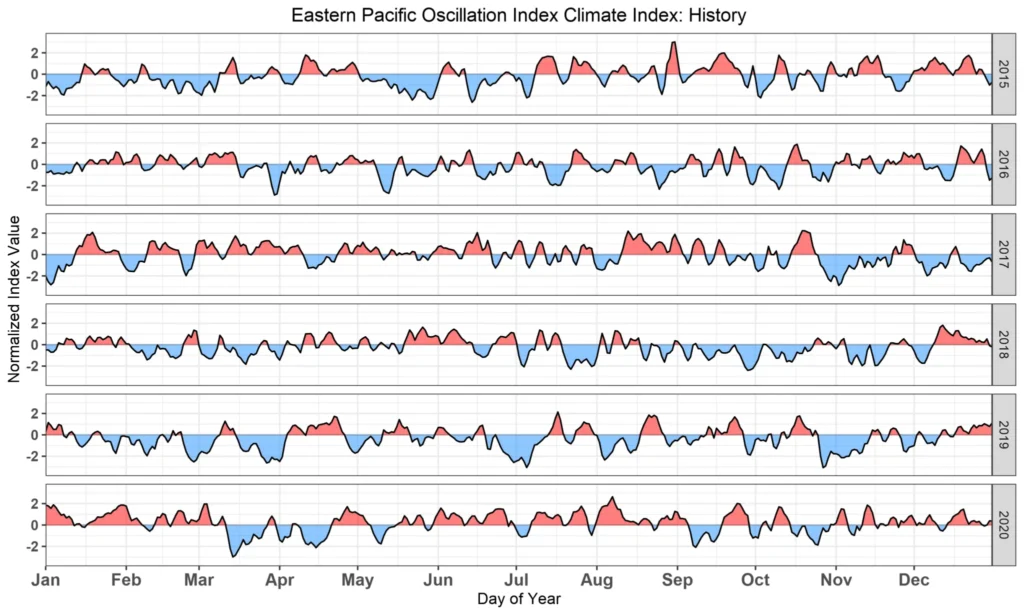
The EPO climate index (Figure 15) tracks the position of the EPO as it cycles between positive and negative phases.
Concluding Remarks about the Eastern Pacific Oscillation
The Eastern Pacific Oscillation is a pressure dipole that exists between Alaska and the Pacific northeast of Hawaii that influences the pattern downstream across much of North America. The EPO is a subseasonal phenomenon which rarely persists in one phase for more than a week or two.
The Eastern Pacific Oscillation is an important driver of US climate variability, as demonstrated to the children of Chicago at Halloween a few years ago. Predictions of the EPO can be an important consideration in subseasonal forecasting because it creates characteristic weather patterns that change with time of year over the lower 48 states.