Climatology Selection in Analog Temperature Forecasting
Analog forecasting and analog climate analysis is useful when preparing a long-range forecast. Examining the evolution of the climate system when conditions in prior years were similar to today’s guides the likelihood of future outcomes.
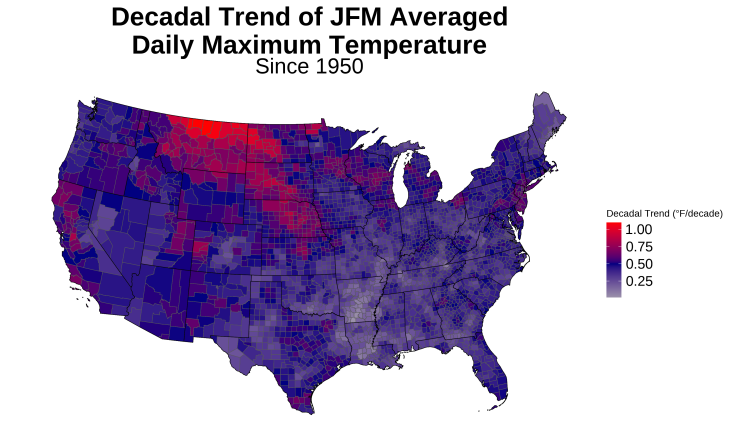
Analog analysis results are usually presented in terms of departure from a long-term normal or climatology reference period. However, for variables with long-term trends the climatology period must be chosen carefully. Figure 1 shows the January through March 1950-2023 linear temperature trend from NOAA’s US county monthly averaged GHCN-D derived data. Temperature-based analog analyses can be particularly impacted by the climatology time period selected.
The World Climate Service recommends using detrended temperatures combined with a climatology period that covers the length of available historical data. The accumulated impact of climate trends is significant enough that shorter, more recent climatology periods can result in seemingly significant cold signals indicated by analog analysis.
While our users have requested the ability to select different climatology periods in temperature analog analyses, we urge caution when using any reference period other than the full history. We discuss why we make this recommendation below.
Temperature Trends – Garfield County, NE
By way of example, Garfield County, NE exhibits a significant daily maximum temperature trend. Figure 2 shows the January, February, and March (JFM) average daily maximum temperatures from 1895 to 2023. Garfield County, NE has experienced a JFM-averaged daily maximum temperature trend of +0.9oF per decade since 1950.
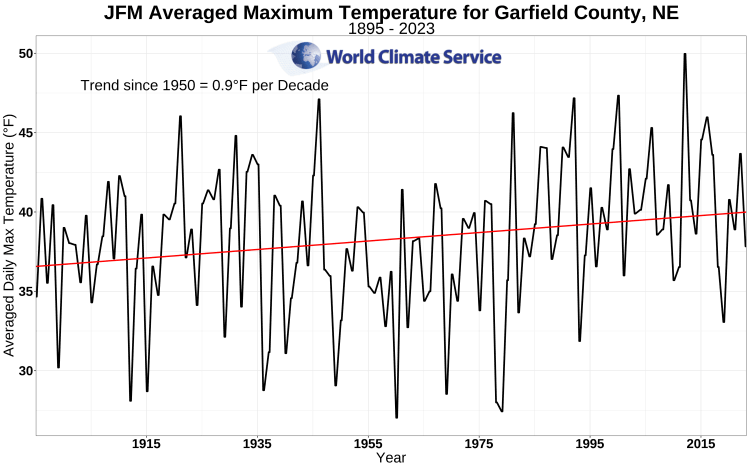
Figure 2. Annual values of January through March average daily maximum temperatures for Garfield County, NE
Impact of Temperature Trends – ENSO Analog Selection
The El Niño/Southern Oscillation and related climate indices are frequently used to identify years for analog analysis. ENSO cycles traditionally result in substantial climate variations in many regions of the world.
Monthly multivariate ENSO index (MEI) data is available in the World Climate Service from 1950 forward. We limit the remainder of this analysis from 1950 to 2023 and use the ENSO cycle to demonstrate the importance of climatology selection in analog analysis. In this case, an El Niño is defined as years when the JFM averaged MEI is greater than 1.0. A La Niña is defined as years when the JFM averaged MEI is less than -1.
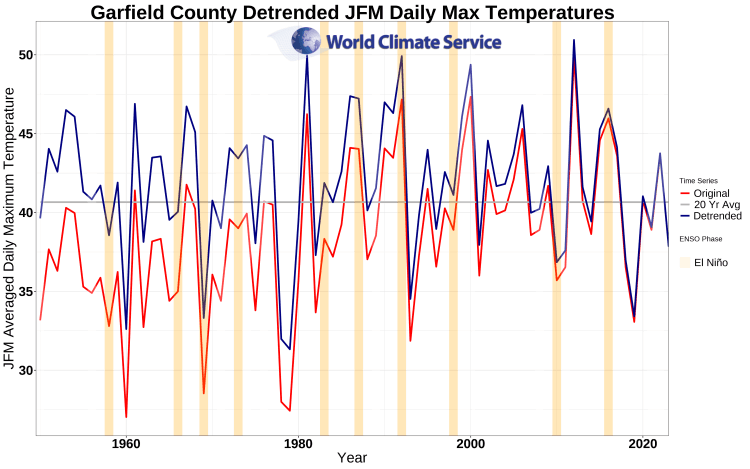
A traditional analog analysis might compare the difference in temperature between El Niño and La Niña years. Figure 3 shows both original and detrended temperatures for Garfield County, along with the most recent JFM 20-year climatology. El Niño years are highlighted.
Now we can examine the deviations of the original and detrended temperature time series from the 2004-2023 climatology, as shown in Figure 4. Note that the only difference from Figure 3 is that temperature anomalies are shown.
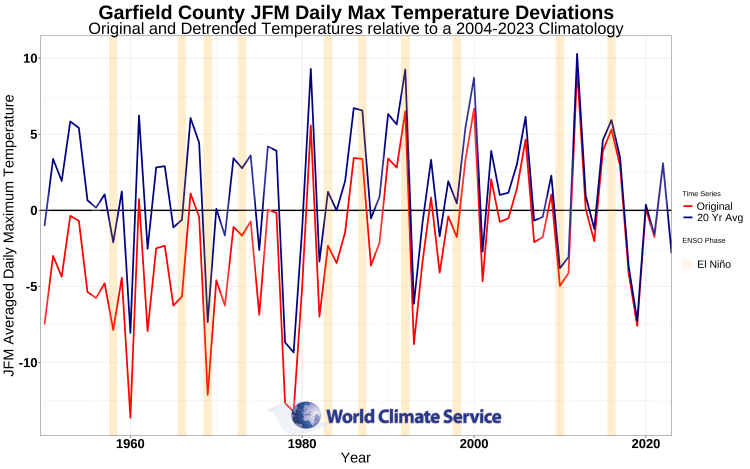
Clearly, the calculated average temperature anomaly in El Niño winters depends greatly on whether the data is detrended or not. If temperatures from several decades ago are compared to a modern climatology, it is obvious that an apparent cold bias is created; the analysis would incorrectly suggest that El Niño winters tend to be cold. This simple analysis illustrates that an historical climate analog analysis can be significantly impacted by trend, and depending on the amplitude of the long-term trend, the results can differ by several degrees, potentially leading to completely different conclusions.
Analog Climatology Selection – Recommendation
The climatology period selected for a temperature analog analysis must be carefully considered because of the impact of climate trends when comparing data from several decades ago. We recommend the following:
- Use a climatology corresponding to the full range of years available in the sample data.
- Analog analysis should use detrending when dealing with strongly trending variables such as temperature or SST.
- If a recent shorter climatology period is chosen, then the years contributing to the analysis should be limited to the same climatology period.