Mont Belvieu Propane Price Forecast: Introduction
Any Mont Belvieu Propane Price Forecast should consider the impact of weather information. The World Climate Service has created an eight-year weather forecast archive to enable commodity traders to win more weather-based trades. The weather forecast models archived include the ECMWF, GEFS, and GFS forecasts. Each 00Z and 12Z initialized 15-day forecast from May 2017 to the present day has been archived and converted into energy market indices. Historical weather forecast data and real-time forecast updates are available through an API.
This data set endeavors to enable customers to explore, quantify, and create value from the relationship between weather forecasts and commodity prices by focusing on the impact of weather forecasts on Mont Belvieu propane prices.
In this case study, we examine the relationship between a history of 00Z ECMWF Forecasts for power production, natural gas consumption weighted heating degree days (GWHDD), and Mount Bellvieu liquid petroleum prices.
Data
Propane Price Data
US EIA provides the LPG spot market price history for Mount Bellvieu. The data is available here.
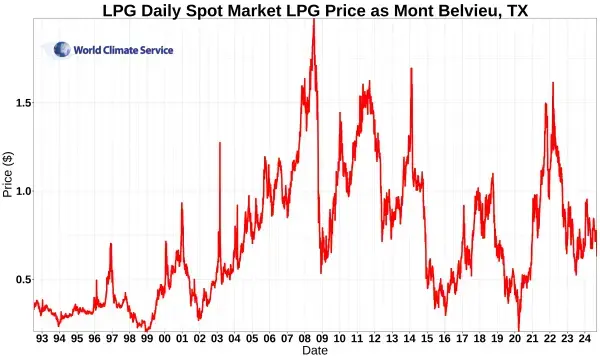 |
| Time series of the Mont Belvieu propane spot market prices. |
The volatility of the spot market prices changes over time. To enable comparison of spot market prices from one period to the next, a rolling 30 day normalization is applied to the spot market price time series. This is calculated by dividing the difference between the daily price and a rolling 30-day mean by the rolling 30-day standard deviation of the spot market price time series.
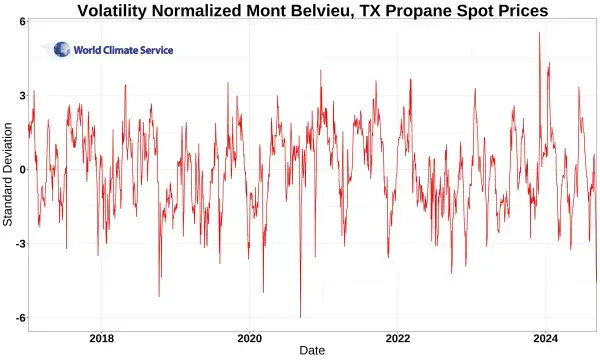 |
| The volatility normalized LPG spot market price. |
Weather Forecast Data
The World Climate Service Point-in-Time Weather Forecast application programming interface (PiTForecast API) provides the weather forecast data.
In this case, we’ve extracted November to March natural gas (for power consumption) weighted heating degree days for Texas. The heating degree days are population-weighted to create a single index representing heating demand in the state. An example of the forecasts is provided below.
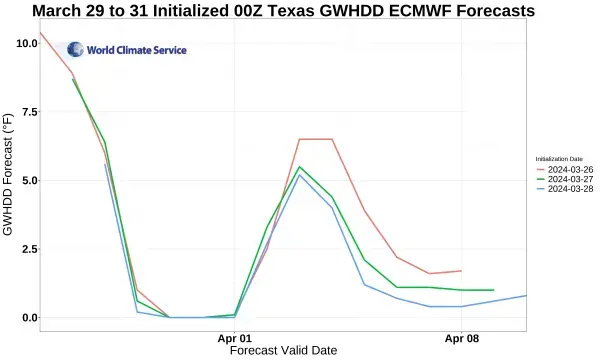 |
| Example ECMWF Texas Gas Weighted HDD Forecasts. |
Application
For each day forecasted, the 20-year climatology was removed from the data by day of year. The GWHDD deviation from climatology is accumulated (i.e., summed) over successive 7-day periods for each initialization date. The result is the seven-day, eight-day, nine-day lead, etc. forecast for 7-day accumulated deviation from climatology GWHDD forecasts.
These weekly forecasts are then compared to the result Mont Belvieu normalized price index for each date ending with the 7-day forecast period.
The relationship between the forecasted 7-day accumulated GWHDD and propane prices for the “zero-day” lead is shown below. The seven-day lead accumulates HDDs up to and including the 6th day from the initialization date of the 00Z forecast. This is the shortest lead time possible for 7-day accumulated forecasts.
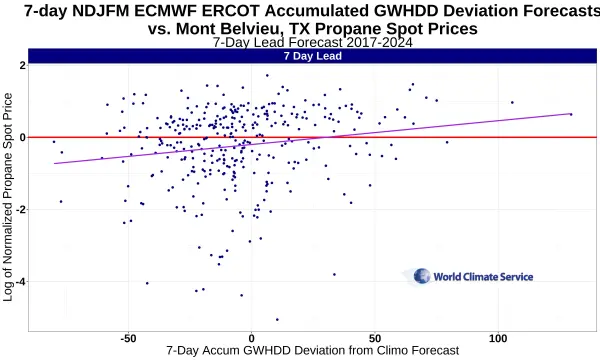 |
| Example: Texas GWHDD ECMWF Forecast vs. Mont Belvieu normalized propane history for a single 7-day lead time forecast. |
The purple line is a linear fit through the data, showing a clear positive relationship. When GWHDDs are lower than usual (i.e., warm temperatures), propane prices tend to be lower than usual and vice versa.

The same analysis can be conducted for all lead times, which is shown below.
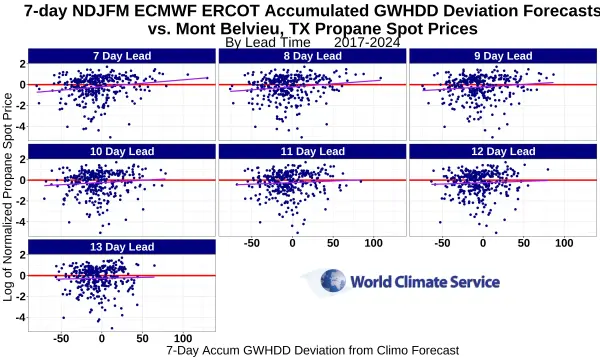 |
| Example: Texas GWHDD ECMWF Forecast vs. Mont Belvieu normalized propane history for all available lead times of a 7-day accumulated deviation from climatology forecast. |
The 7-day lead forecast is the short forecast lead-time, so it’s not surprising that the slope is steepest in that instance.
Further Analysis
Further analysis is warranted to determine why the spread is so large near the GWHDD deviation of near zero. Possible next steps include:
- Examine the price time series for day-of-week sensitivity. This was not considered in this analysis. For example, a “day of week” regression can be applied to determine if price data is sensitive to the day of week.
- Conduct the same analysis for holidays.
- Examine the price time series for substantial one-day changes explainable by geo-political or other energy market events.
- Evaluate the sensitivity of other HDDs in other regions and CDDs in summer.
More Examples?
Interested in more examples of how to apply an eight-year archive of weather forecasts to energy trading applications? Be sure to check out our forecasting ERCOT curtailment post.
Conclusion
A simple analysis enabled by the seven-year weather forecast history created by the World Climate Service demonstrates a clear relationship between Texas population-weighted gas-weighted HDDs and a normalized propane price index. This information, combined with real-time updated forecasts, can be used to implement a propane price optimization strategy.