Unveiling the Southern Annular Mode (SAM): Key Insights Into Climate Variability and Impacts on Australia and Beyond
Introduction
Between December and February 2011, a positive phase of the Antarctic Oscillation (AAO), also known as the Southern Annular Mode (SAM), triggered widespread and unprecedented flooding across multiple regions of Australia. Some areas experienced rainfall levels nearly 300% above normal, as illustrated in Figure 1 using the World Climate Service ERA5 reanalysis tool. This extreme weather event highlights the profound influence of large-scale climate drivers like SAM on regional weather patterns, agriculture, and economic outcomes.
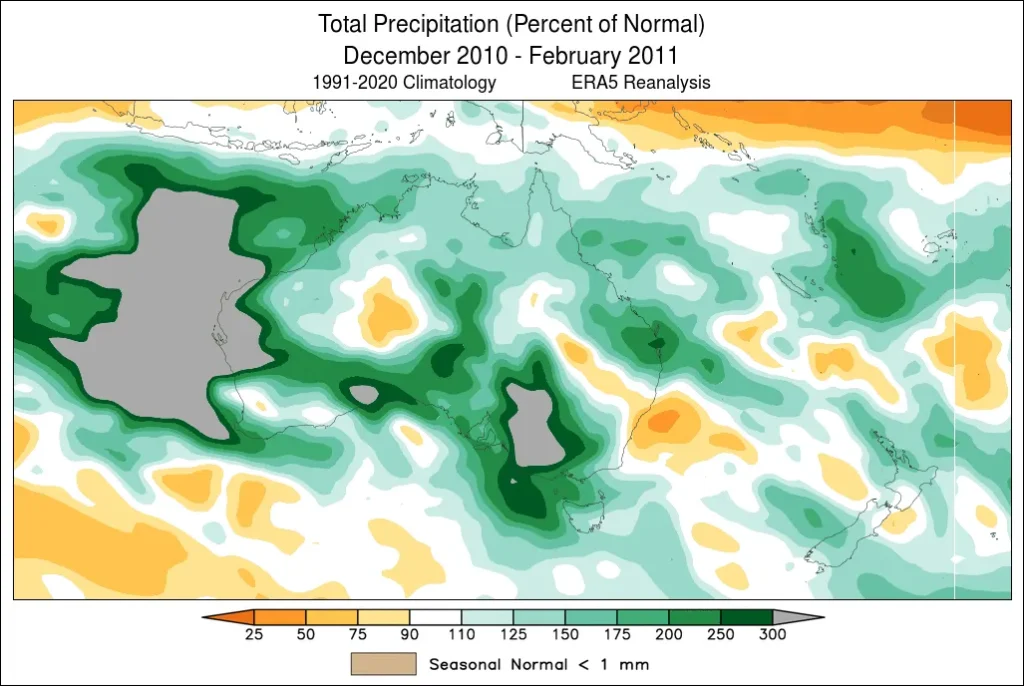
Figure 1. An example of the World Climate Service climate index analogs tool showing the percent of years having above-normal December through February precipitation during a positive SAM.
Figure 2 highlights the percentage of years with above-normal precipitation during December through February under a positive SAM phase, emphasizing the increased likelihood of heightened rainfall in such periods.
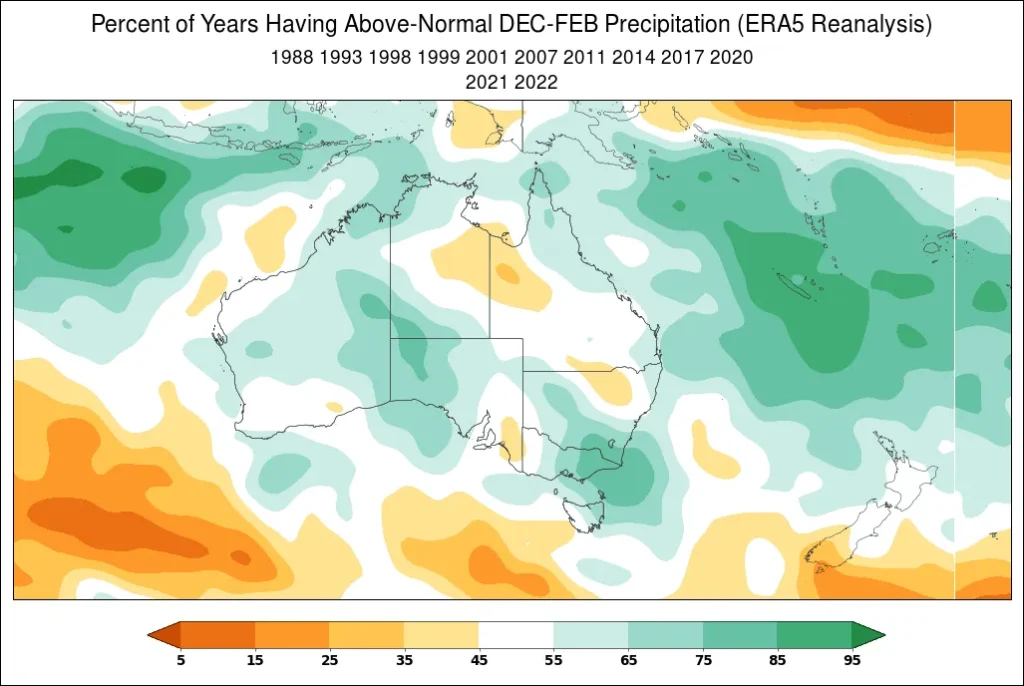
Figure 2. Illustration of the Australian floods from December 2010 to February 2011, depicting total precipitation as a percentage of normal using the World Climate Service ERA5 reanalysis tool.
The SAM is a key climate index for predicting Australian climate in that it captures the shifting atmospheric dynamics of the Southern Hemisphere. It reflects changes in the strength and positioning of the westerly wind belt encircling Antarctica, influencing atmospheric pressure distribution between mid-latitudes (around 40°S) and high latitudes near Antarctica (around 65°S). These atmospheric shifts shape weather patterns across the hemisphere, making SAM a critical tool for understanding climate variability and its implications.
Positive SAM phases, such as during the 2011 floods, are characterized by strengthened westerly winds that shift closer to Antarctica, leading to lower-than-normal pressure over the continent (Figure 3). This often results in drier conditions in southern Australia but wetter conditions in parts of southern South America. Conversely, negative SAM phases (Figure 3) weaken the westerly winds, shifting storm tracks northward, leading to higher-than-normal Antarctic pressure, increased rainfall in southern Australia, and cooler conditions in the mid-latitudes.
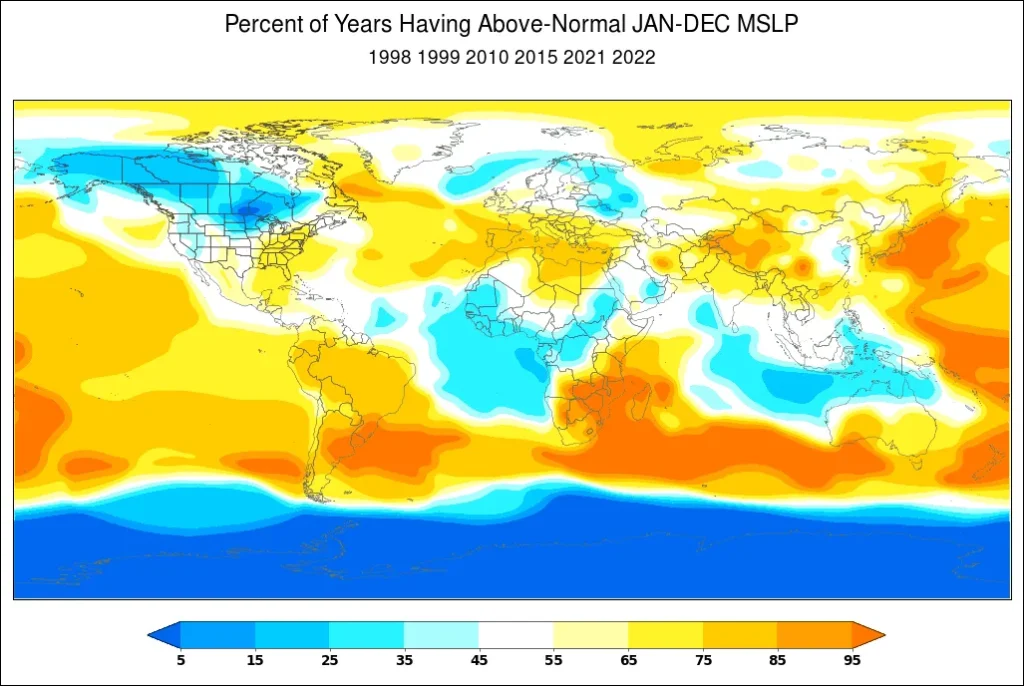
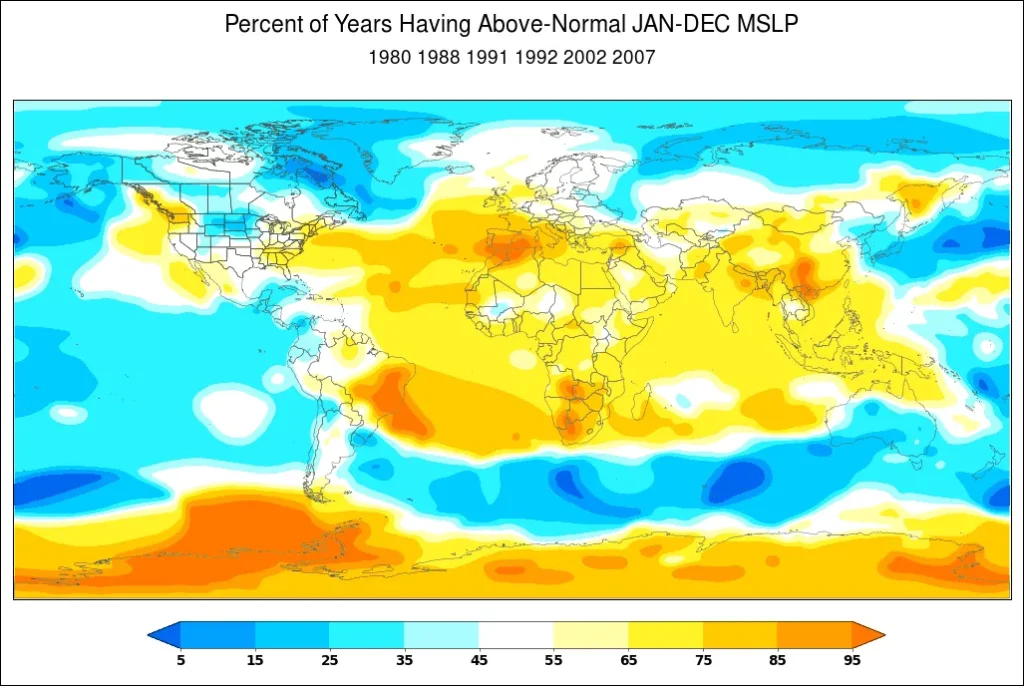
Figure 3. World Climate Service climate index analogs tool showing the percent of years having above-normal January through December mean sea-level pressure during a strongly positive AAO (SAM) (top). World Climate Service climate index analogs tool showing the percent of years having above-normal January through December mean sea-level pressure during a strongly negative AAO (SAM) (bottom).
Understanding climate drivers like SAM is important, as Jeff Bennett reflects on the 2011 floods: “The 2011 floods in Australia were unlike anything seen before, unparalleled in depth, frequency, and geographic spread” (Bennett, 2011). Tools like the World Climate Service climate index analogs and ERA5 reanalysis provide invaluable insights into monitoring and anticipating such events, as shown in Figure 1 and Figure 2.
Extending beyond precipitation impacts, SAM’s variability affects temperature, storm tracks, and ocean circulation, driving significant seasonal and interannual climate effects. By providing a window into the Southern Hemisphere’s (South America and Australia) atmospheric behavior, SAM is an essential resource for long-range weather forecasting and climate risk assessment, aiding sectors like agriculture, energy, and water management.
What is the Southern Annular Mode (SAM) Index?
The SAM index is typically calculated as the difference in zonal mean sea-level pressure (MSLP) between two latitudes (Equation 1):
Equation 1: 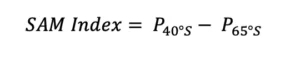
Where:
- P40°S is the mean sea-level pressure at 40°S (representing mid-latitudes).
- P65°S is the mean sea-level pressure at 65°S (representing high latitudes near Antarctica).
The index is often standardized (normalized) by subtracting the long-term mean and dividing by the standard deviation of the MSLP difference (Equation 2). This normalization ensures comparability across different time periods. This equation captures the shifts in atmospheric mass and westerly wind belts associated with the SAM.
Equation 2: 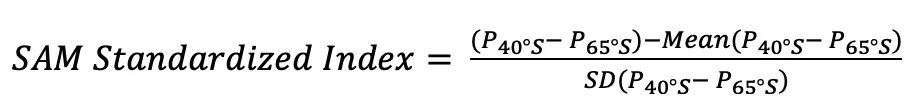
Figure 4 from the World Climate Service presents the daily SAM index spanning 2010 to 2024, highlighting real-time trends and fluctuations.
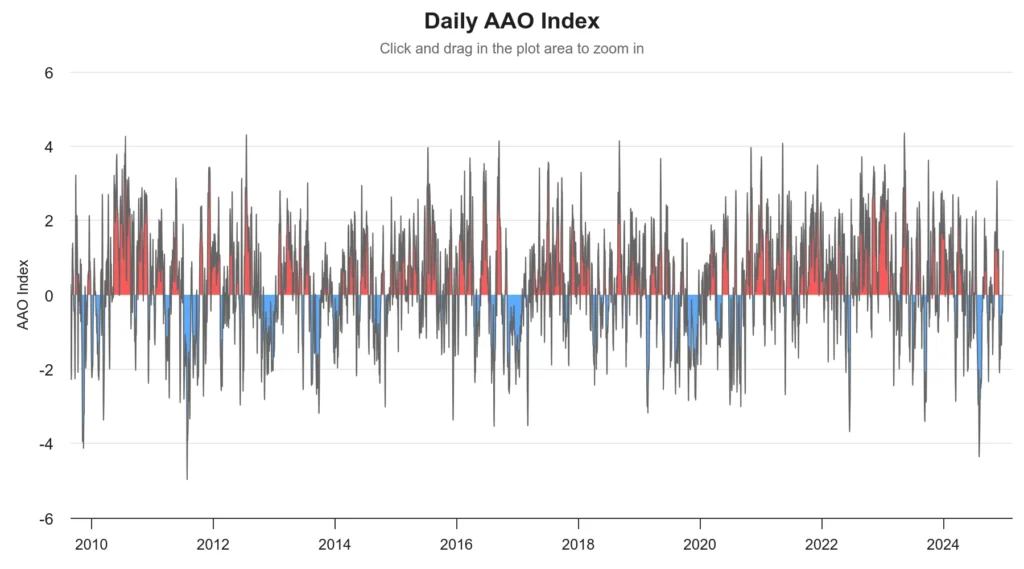
Figure 4. Represents the daily SAM index chart from 2010 through that is provided by the World Climate Service.
SAM Phases and Their Impacts
Strongly Negative SAM:
Once again, a negative Southern Annular Mode (SAM) phase occurs when atmospheric pressure over Antarctica is higher than normal. This shift weakens the westerly wind belt, allowing storm systems to penetrate farther north.
Australia
Focusing on Australia during June through August, let’s analyze the impact of a strongly negative SAM/AAO has on Australia 2-meter temperature (Figure 5) and precipitation (Figure 6).
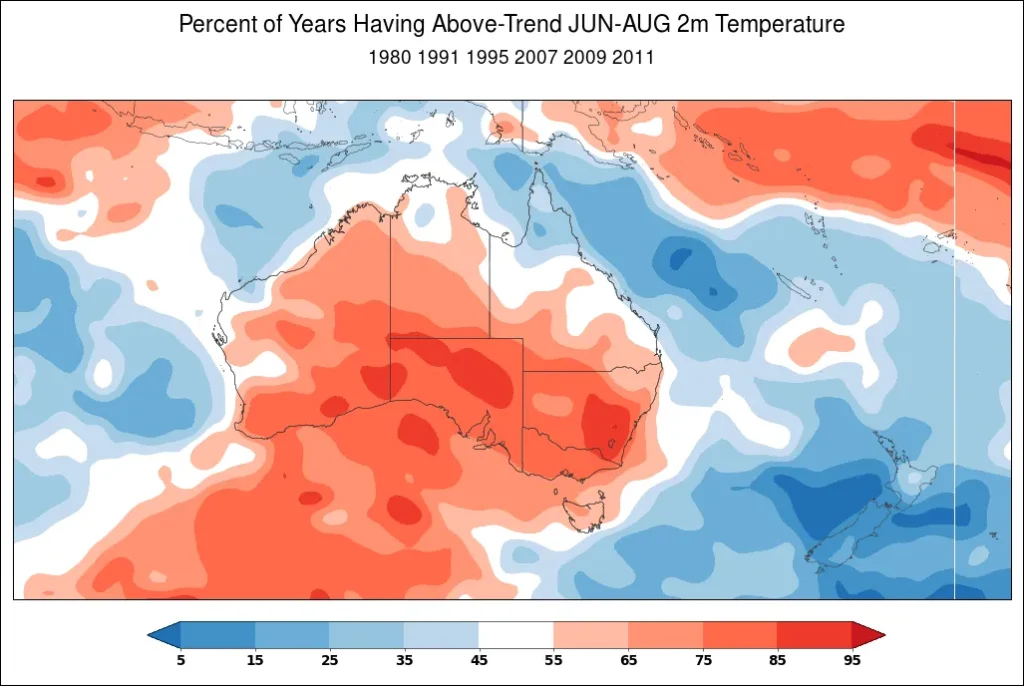
Figure 5. An example of the World Climate Service climate index analogs tool showing the percent of years having above-trend June through August 2-meter temperature in Australia during a strongly negative.
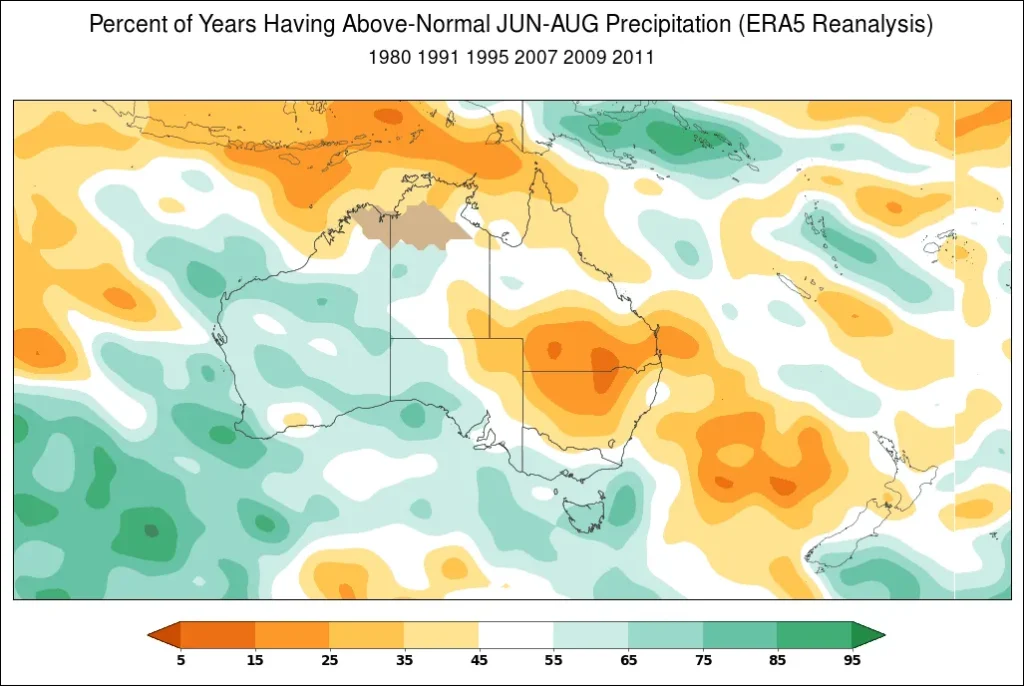
Figure 6. An example of the World Climate Service climate index analogs tool showing the percent of years having above-trend June through August precipitation in Australia during a strongly negative.
Figure 5 shows that through the majority of Australia there is an increased likelihood of above-normal June through August 2-meter temperatures across Australia during a strongly negative. On the other hand, Figure 6 shows that there are very low probabilities of the percent of years having above-normal June through August precipitation in eastern Australia during a strongly negative. Although, in western Australia, there is an increased likelihood of above-normal June through August precipitation during a strongly negative.
South America
During a strongly negative SAM during June through August, Figure 7, the north and northwest regions of South America show an increased likelihood of observing above-normal June through August 2-meter temperatures during a strongly negative SAM. Conversely, the southern part of the continent shows very low probabilities of observing above-normal June through August 2-meter temperatures during a strongly negative SAM.
Figure 8 shows the percent of years having above-normal June through August precipitation in South America during a strongly negative SAM. The majority of South America, besides far southern Brazil and Uruguay, shows very low chances at receiving above-normal June through August precipitation during a strongly negative SAM.
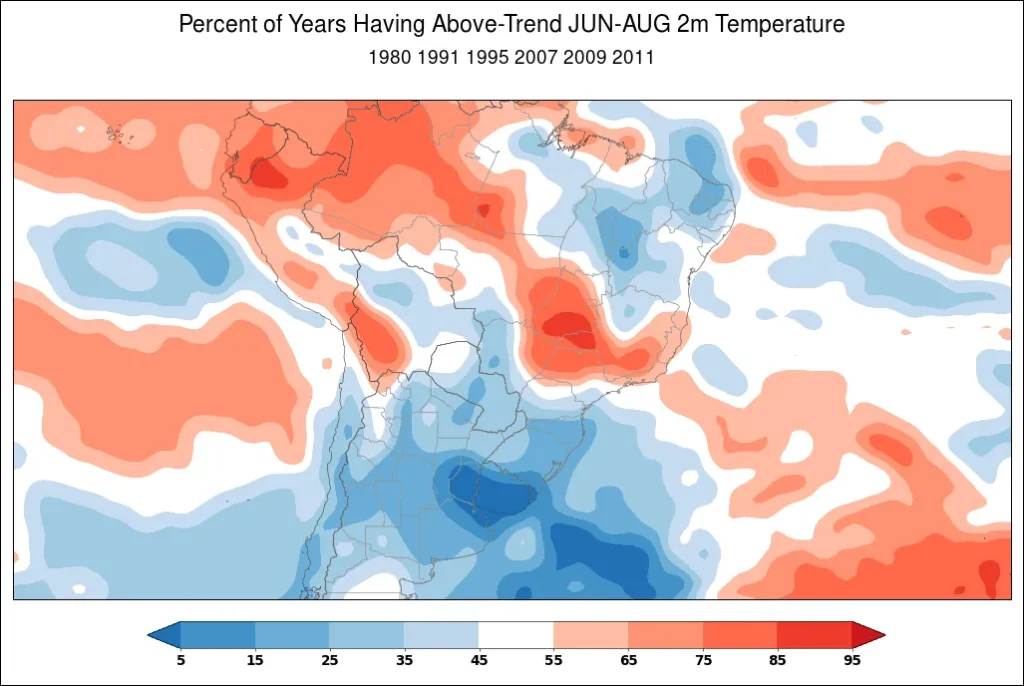
Figure 7. Percent of years having above-trend June through August 2-meter temperature in South America during a strongly negative SAM.
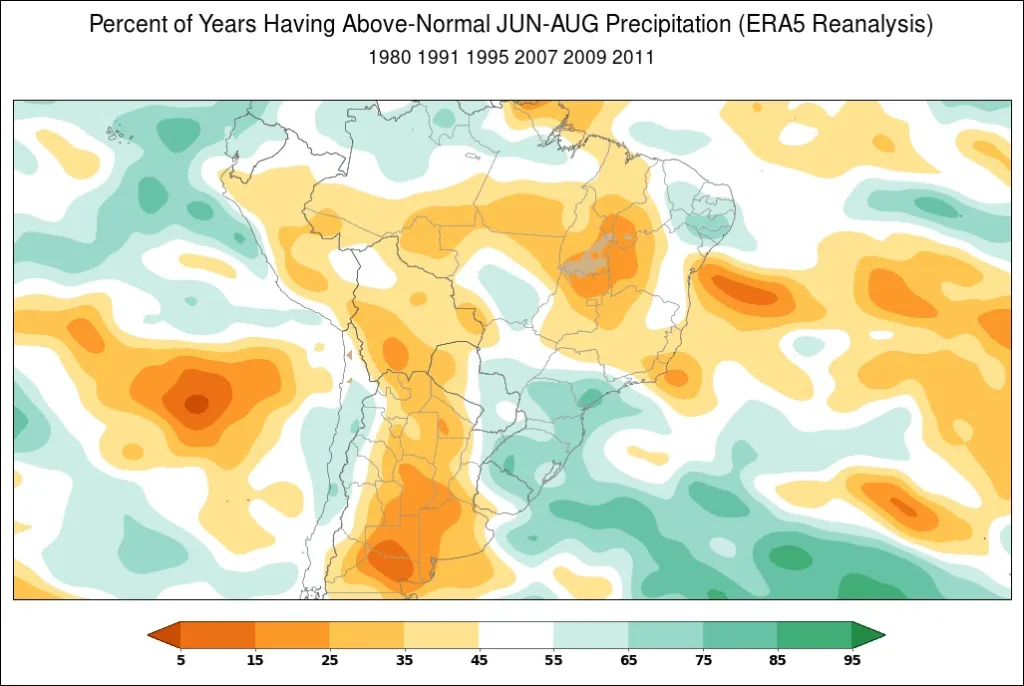
Figure 8. Percent of years having above-normal June through August precipitation in South America during a strongly negative SAM.
Strongly Positive SAM:
A positive SAM phase is characterized by lower-than-normal pressure over Antarctica. This strengthens the westerly wind belt, concentrating it closer to Antarctica
Australia
Continuing to focus on Australia, Figure 9 and Figure 10 illustrate the impact of a strongly positive SAM/AAO on 2-meter temperature and precipitation during the months of June through August.
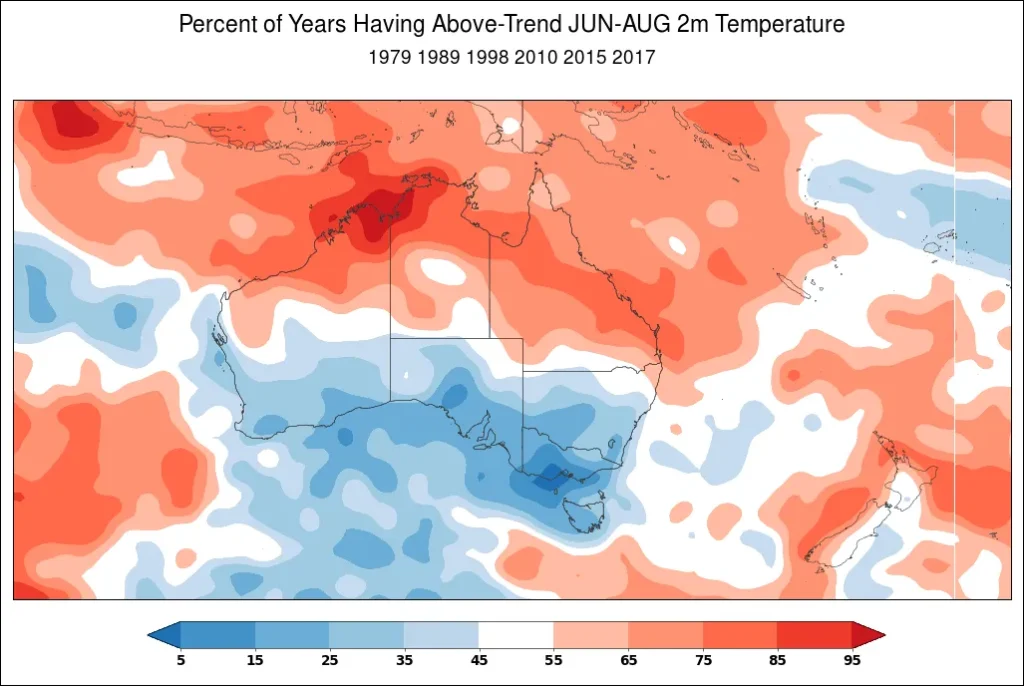 Figure 9. An example of the World Climate Service climate index analogs tool showing the percent of years having above-trend June through August 2-meter temperature in Australia during a strongly positive.
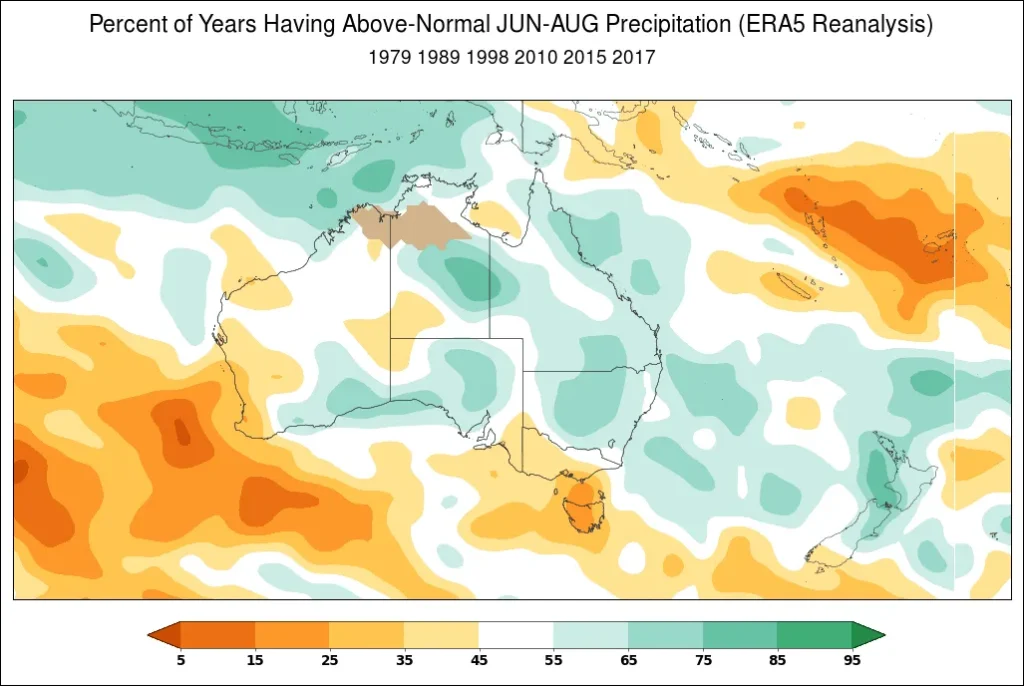
Figure 10. An example of the World Climate Service climate index analogs tool showing the percent of years having above-trend June through August precipitation in Australia during a strongly positive.
Figure 9 indicates that the southern half of Australia has a low probability of experiencing above-normal 2-meter temperatures from June through August, while the northern regions show a higher likelihood of above-normal temperatures during a strongly positive. Additionally, Figure 10 reveals that most of Australia has an increased probability of receiving above-normal precipitation during this period, though certain areas exhibit lower likelihoods.
South America
Figure 11 highlights that most of South America, excluding southeastern Brazil, experiences an increased likelihood of above-normal 2-meter temperatures from June through August during a strongly positive SAM. In contrast, Figure 12 does not exhibit any distinct or consistent patterns comparable to the others.
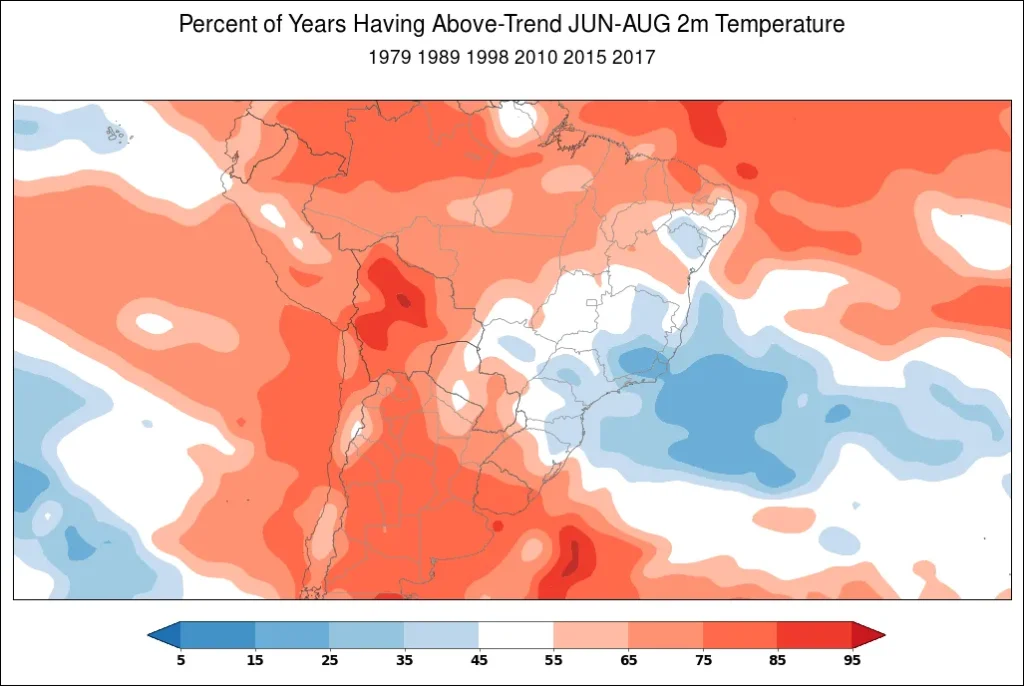
Figure 11. Percent of years having above-trend June through August 2-meter temperature in South America during a strongly positive SAM.
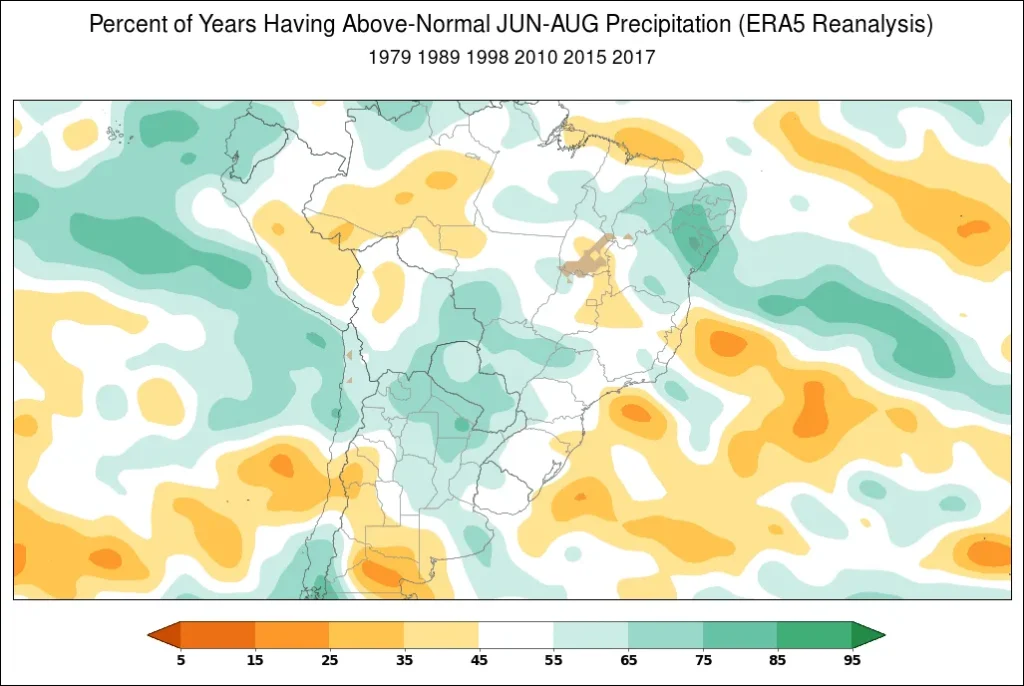
Figure 12. Percent of years having above-normal June through August precipitation in South America during a strongly positive SAM.
Nearly Neutral SAM:
During a neutral SAM phase, atmospheric pressure patterns and wind belts remain close to their average state.
Australia
Figure 13 and Figure 14 depict the effects of a nearly neutral SAM/AAO on 2-meter temperature and precipitation during June through August. In Figure 13, under a nearly neutral, most of Australia shows low probabilities of experiencing above-normal 2-meter temperatures, with the exception of the far northern tip and the eastern coast, which have slightly higher probabilities. In Figure 14, there are no strong probabilities of above-normal precipitation during this period, although the southwest coast of Australia exhibits very low probabilities of above-normal precipitation under a neutral.
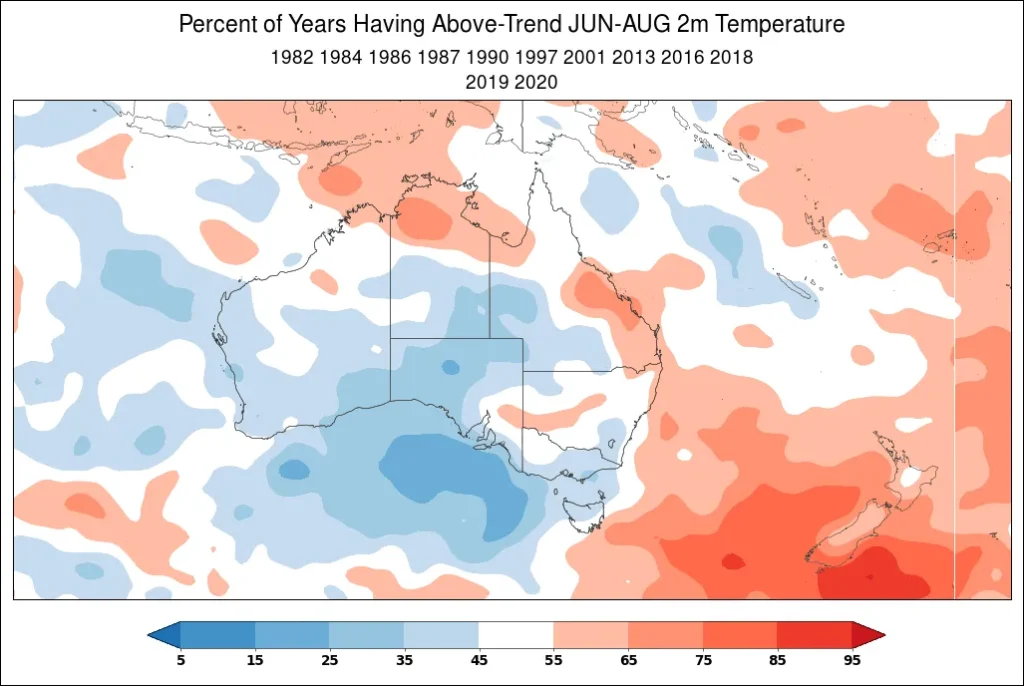
Figure 13. An example of the World Climate Service climate index analogs tool showing the percent of years having above-trend June through August 2-meter temperature in Australia during a nearly neutral SAM.
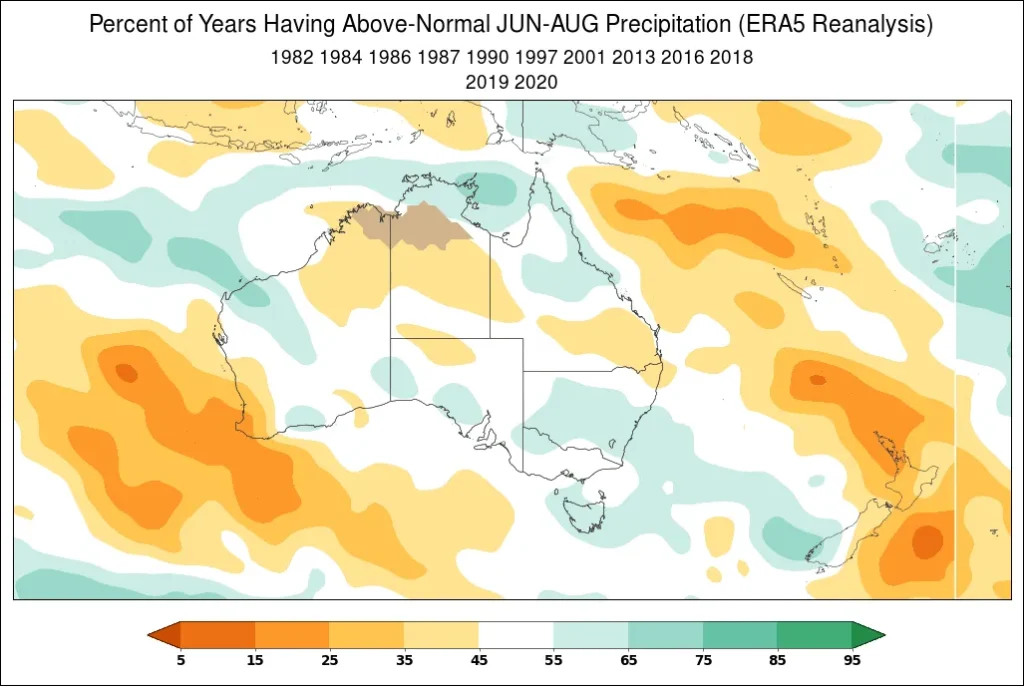
Figure 14. An example of the World Climate Service climate index analogs tool showing the percent of years having above-trend June through August precipitation in Australia during a nearly neutral SAM.
South America
Figure 15 shows that the majority of the eastern half of South America exemplifies higher probabilities of observing above-normal June through August 2-meter temperatures during a nearly neutral SAM.
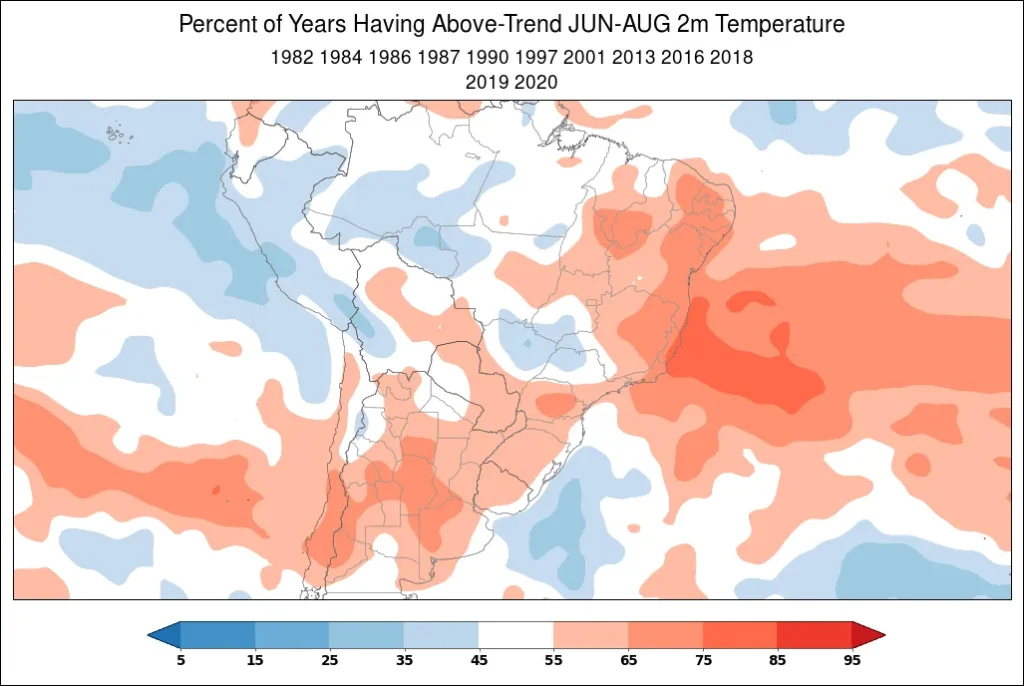
Figure 15. An example of the World Climate Service climate index analogs tool showing the percent of years having above-trend June through August 2-meter temperature in South America during a nearly neutral SAM.
The majority of South America, especially Brazil, shows that there is an increased likelihood of those regions observing above-normal June through August precipitation during a nearly neutral SAM (Figure 16). Although, there is a bullseye in parts of southern South America where there are very low probabilities of above-normal June through August precipitation during a nearly neutral SAM.
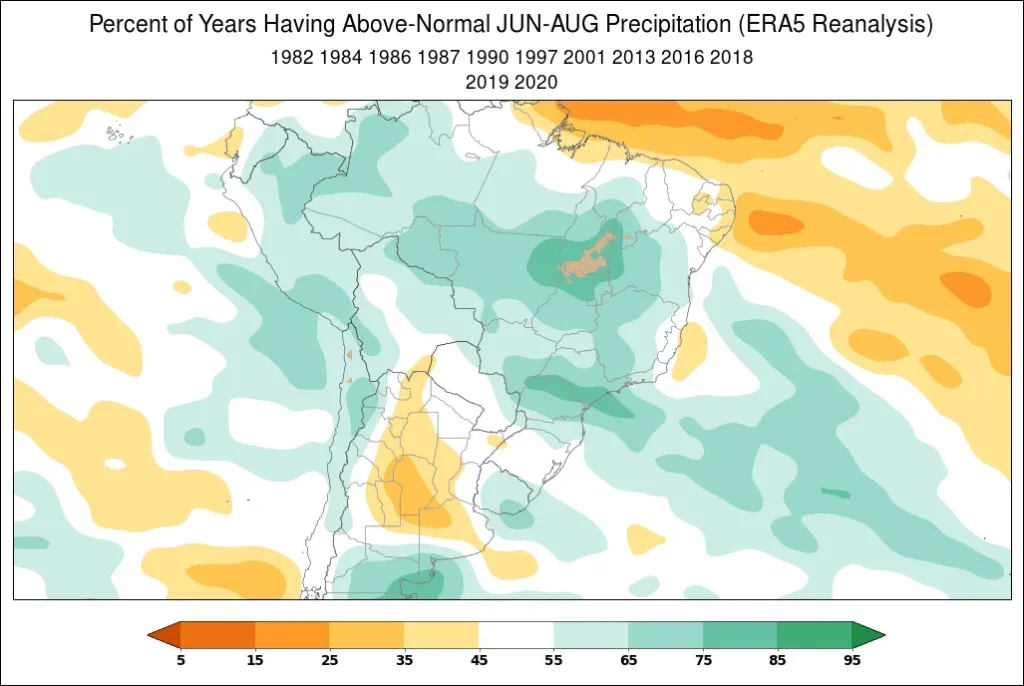
Figure 16. An example of the World Climate Service climate index analogs tool showing the percent of years having above-trend June through August precipitation in South America during a nearly neutral SAM.
Case Studies and Examples
Strong positive SAM summer:
A notable instance of a strongly positive SAM or AAO during June, July, and August occurred in 2017. Figure 17, which displays the average 2-meter temperature anomaly (°C) for June through August 2017, aligns closely with Figure 9. Both figures highlight an increased likelihood of above-normal 2-meter temperatures across northern Australia during this period under a strongly positive SAM.
Similarly, Figure 18 presents total precipitation as a percentage of normal for June through August 2017, based on 1991–2020 climatology. This aligns well with Figure 10, which shows a distinct bullseye of very high probabilities for above-normal precipitation, mirroring the higher-than-normal precipitation values observed in Figure 18.
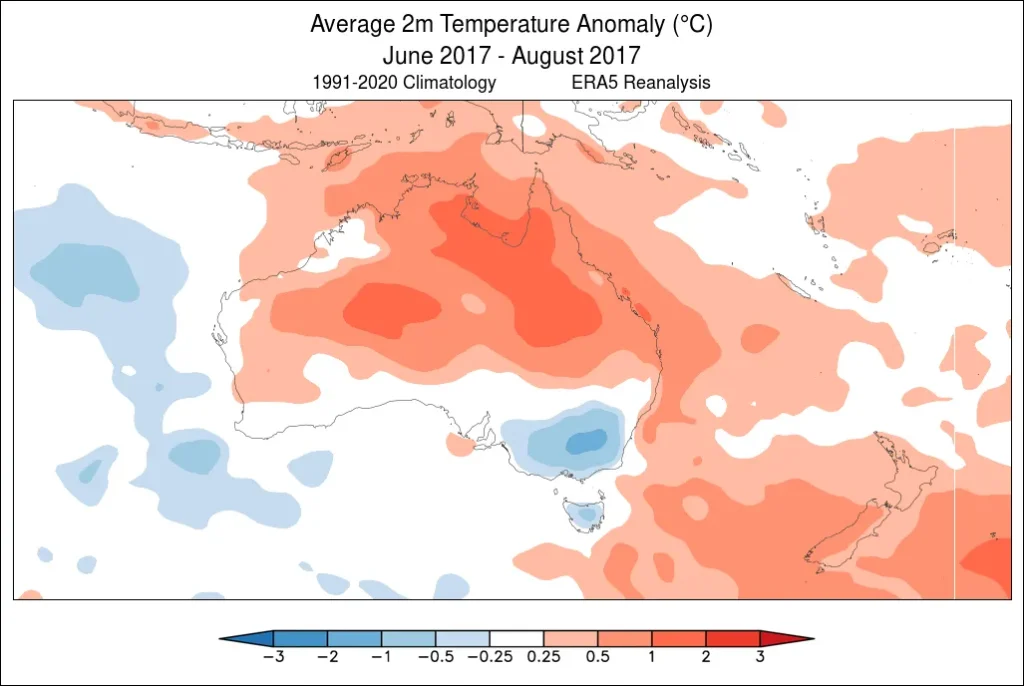
Figure 17. An example of the World Climate Service ERA5 reanalysis tool which shows the average 2-meter temperature in °C in Australia during June through August 2017 during a strongly positive SAM.
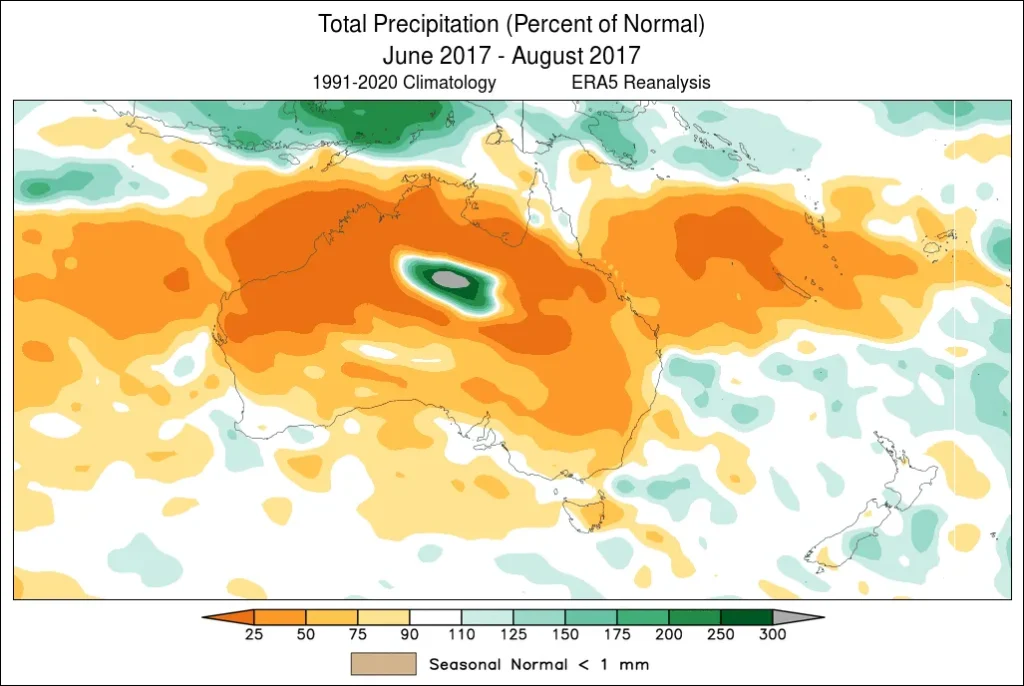
Figure 18. An example of the World Climate Service ERA5 reanalysis tool which shows the total precipitation in percent of normal in Australia from June through August 2017 during a strongly positive SAM.
Strong negative SAM summer:
One instance of a strongly negative SAM during June through August occurred in 2011. When comparing Figure 19 with Figure 5, there is a clear signal of above-normal 2-meter temperatures occurring in the southern half of Australia. Both figures consistently indicate this pattern.
Additionally, Figure 20 and Figure 6 highlight a similar relationship, showing an increased likelihood of above-normal precipitation along the southwest coast of Australia, while also indicating very low probabilities of above-normal precipitation in southeast Australia.
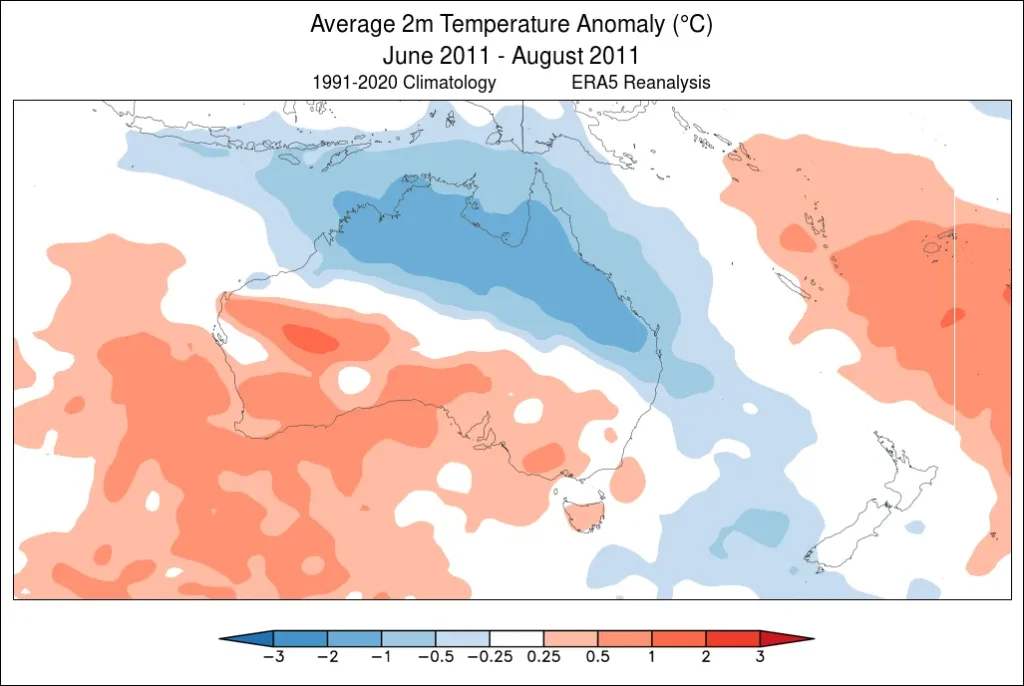
Figure 19. An example of the World Climate Service ERA5 reanalysis tool which shows the average 2-meter temperature in °C in Australia during June through August 2017 during a strongly negative SAM.
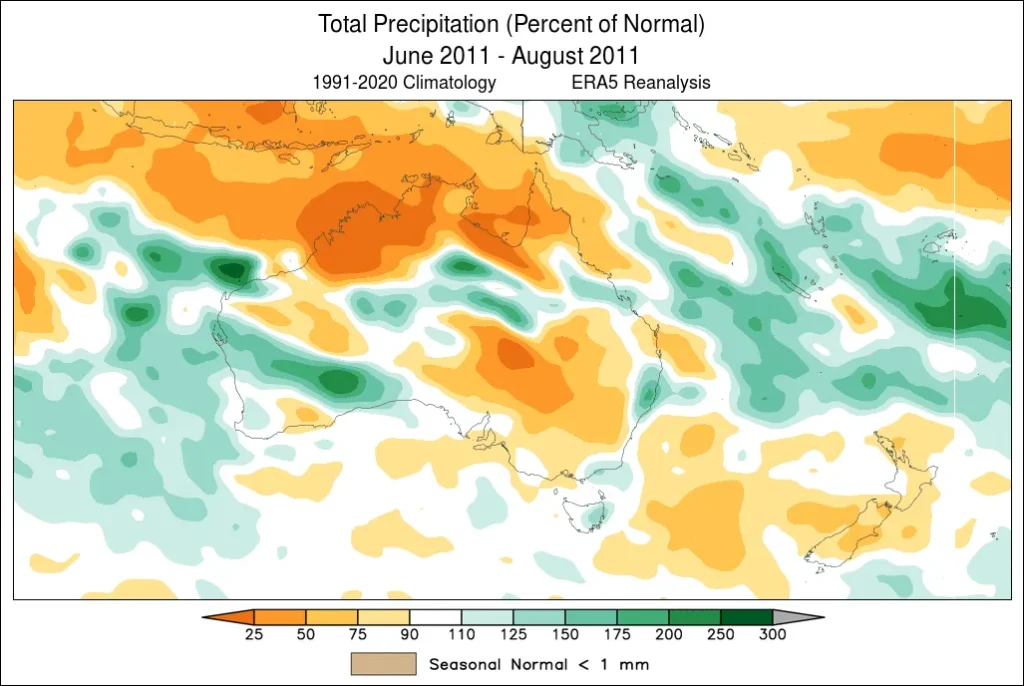
Figure 20. An example of the World Climate Service ERA5 reanalysis tool which shows the total precipitation in percent of normal in Australia from June through August 2017 during a strongly negative SAM.
Forecasting Applications of SAM
The Southern Annular Mode (SAM) is a powerful tool for understanding seasonal weather patterns across the Southern Hemisphere. By analyzing shifts in atmospheric pressure and westerly wind belts, SAM provides valuable insights into temperature and precipitation trends. These trends are crucial for anticipating climate impacts on industries such as agriculture, energy, and water resource management. The ability to interpret SAM-driven variability enables businesses and policymakers to make informed decisions and mitigate risks associated with climate variability.
Leveraging SAM with World Climate Service
While the SAM index is highly informative, its utility increases significantly when combined with advanced forecasting tools like those offered by the World Climate Service. The platform integrates SAM data with other key climate indices, such as the Southern Oscillation Index (SOI) and the Indian Ocean Dipole (IOD), to provide a comprehensive understanding of seasonal climate variability.
The World Climate Service employs several cutting-edge techniques to maximize the potential of SAM for forecasting:
- Analog Forecasting: Using historical patterns of SAM and related indices to predict future weather conditions.
- Statistical Models: Advanced algorithms that combine SAM data with other climatic inputs to identify correlations and trends, enhancing forecast accuracy.
- Visualization Tools: Intuitive graphical interfaces that allow users to monitor real-time SAM fluctuations and assess their implications for specific regions and timeframes.
These capabilities empower users to assess SAM’s influence on precipitation and temperature trends, optimize resource allocation, and reduce operational risks tied to weather and climate variability.
By leveraging the tools provided by the World Climate Service, businesses and industries can unlock the full potential of SAM-based forecasting to navigate the challenges of a changing climate effectively.
Accessing Reliable SAM-Based Forecasts
The World Climate Service provides a comprehensive platform to access reliable forecasts based on the Southern Annular Mode (SAM). By leveraging advanced climate modeling and real-time SAM data, the platform delivers actionable insights for industries and decision-makers. These forecasts enable users to anticipate shifts in temperature, precipitation, and storm patterns driven by SAM phases.
Through the World Climate Service, users can:
- Monitor Real-Time SAM Trends: Access up-to-date data and projections to track ongoing SAM fluctuations.
- Explore Seasonal Forecasts: Utilize forecasts that incorporate SAM’s influence on seasonal weather patterns, enhancing preparedness and planning.
- Compare Multiple Indices: Evaluate SAM alongside other climate indices, such as the Indian Ocean Dipole (IOD) and Southern Oscillation Index (SOI), to gain a broader perspective on climate variability.
This intuitive platform empowers clients to integrate SAM-based forecasts into their operations, from agriculture and energy to risk management and logistics. By understanding and acting on SAM-driven climate signals, businesses can reduce weather-related risks, optimize resource use, and improve decision-making in the face of changing climate conditions.
Conclusion
The Southern Annular Mode (SAM) otherwise known as the Antarctic Oscillation (AAO) is more than just a measure of atmospheric pressure differences—it serves as a gateway to understanding and managing climate variability across the Southern Hemisphere. By analyzing SAM phases, industries can anticipate temperature, precipitation, and storm patterns that directly impact agriculture, energy, and water resource management.
With tools like the World Climate Service, businesses can integrate SAM-based insights into their decision-making processes. Combining SAM data with other climate indices provides a comprehensive framework for understanding seasonal climate variability, allowing for better preparation and risk mitigation.
Explore the World Climate Service to access cutting-edge forecasting tools and gain a competitive edge in navigating climate-related challenges. By harnessing the power of SAM and other climate indices, you can transform uncertainty into actionable opportunities and ensure resilience in a changing climate.
Works Cited
Bennett, Jeff. “Australia’s Floods and Farming.” East Asia Forum, 28 Jan. 2011, eastasiaforum.org/2011/01/28/australias-floods-and-farming/.