Climate indices provide a useful numerical framework to describe broad-scale weather patterns. As they help meteorologists describe weather patterns then they are vital tools in long-range weather prediction.
What is a Climate Index – Definition
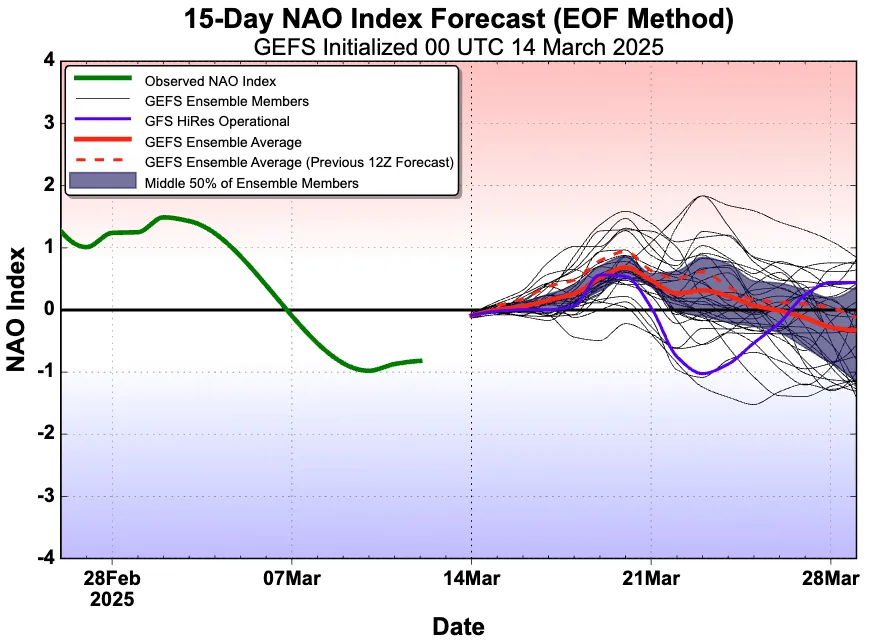
Climate variability research has shown that parts of the Earth display alternating weather types and that the weather over large areas tends to swing back and forth between two favored states. In Northwest Europe, for example, the prevailing wind flow is westerly, but sometimes that westerly is stronger than normal, and other times the westerly flow is weaker than normal (or even reverses temporarily to become easterly).
Each extreme in this European cycle brings a very different type of weather in Europe. For example, a strong westerly flow means much of Southern Europe will usually be dry, while a weak westerly flow often brings excessive rainfall to parts of Southern Europe. This particular cycle is known as the North Atlantic Oscillation (NAO) shown in Figure 1, and this is one example of a climate cycle (sometimes referred to as a teleconnection). A climate index describes the position of the climate cycle within its range at a given moment in time.
There can be no doubt that the atmosphere is a complex system. As a result of this, it is challenging to comprehend and describe the atmospheric motion and weather conditions at each point on Earth, at all altitudes. A climate index helps to simplifies vast amounts of data about current, past, and future atmospheric conditions to improve communication regarding specific circulation phenomena and their impacts.
Atmospheric Pressure Based Climate Indices
The NAO is defined by a pressure variation over the North Atlantic. There are other climate indices around the world based on geographic variations in atmospheric pressure. Many of the indices are named based on their location on Earth.
Other examples of atmospheric pressure-based climate indices:
- Arctic Oscillation (AO)
- Pacific North America pattern (PNA)
- Eastern Pacific Oscillation (EPO)
- Western Pacific Oscillation (WPO)
- Scandinavian Pattern (SCAND)
- East Atlantic / Western Russia pattern (EA/WR)
- Southern Oscillation Index (SOI)
- Southern Annular Mode (SAM) or Antarctic Oscillation (AAO)
- North Atlantic Oscillation (NAO)
Sea Surface Temperature (SST) Climate Indices
Sea surface temperatures can have significant impacts on regional and even global climate. As a result, there are several SST-based climate indices that climate scientists follow closely. The most prominent oceanic climate index is the El Niño Southern Oscillation (ENSO). A vast stretch of the equatorial Pacific swings between warmer than normal surface waters (El Niño) and cooler than normal surface waters (La Niña). The variations in SSTs modify the global atmospheric circulation and, as a result, are a source of predictability in long-range forecasts.
The phases of the ENSO climate index can persist for many months and sometimes even years, which often influences the weather across large swaths of the globe.
Other examples of SST climate indices:
- Atlantic Multi-decadal Oscillation (AMO)
- Indian Ocean Dipole (IOD)
- North Pacific Mode (NPM)
- Pacific Decadal Oscillation (PDO)
Madden-Julian Oscillation – A Subseasonal Climate Index
The Madden-Julian Oscillation or MJO is a little different from the other climate indices. The MJO is a convective wave that progresses west to east through the tropics near the equator in the Pacific and Indian Oceans. In this case, the climate index is a phase space diagram describing the tropical location of the wave.
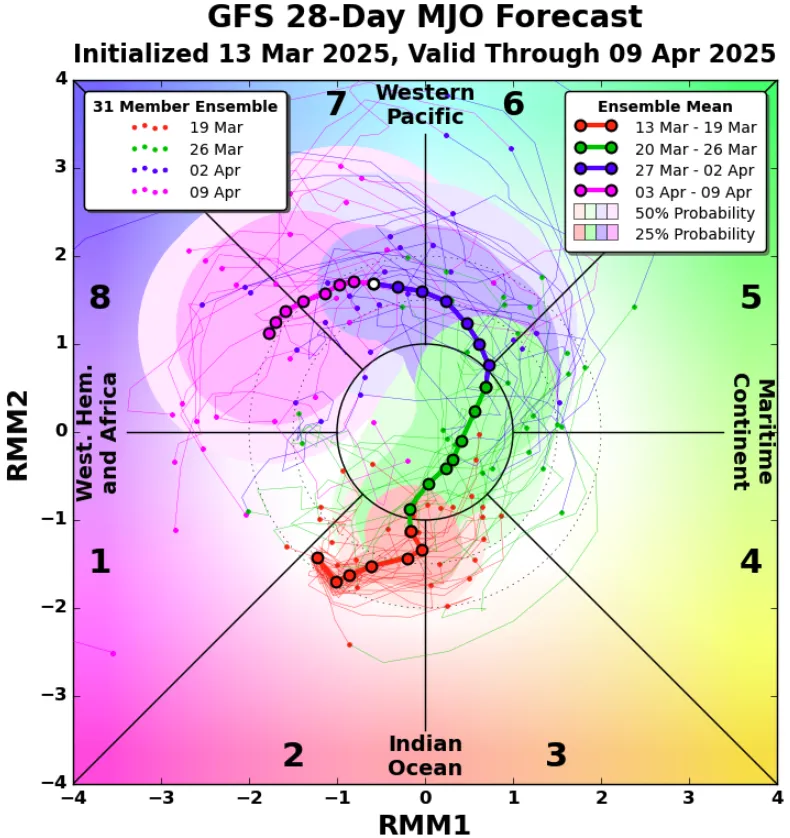
Fig. 2: This Hendon-Wheeler diagram shows the GFS MJO subseasonal forecast. The MJO starts out in phase 2 (red dots) and then orbits counter clockwise to represent the wave traveling across the tropics
What is a Climate Index – Communicating the Weather
The fact a climate index is associated with characteristic weather patterns in a specific location makes communicating long-range weather forecast information easier.
For example, if both parties are sufficiently familiar with the climate index patterns, then we might use phrases such as; “the temperature pattern over North America is very consistent with a La Nina.” Another example is “the rainfall distribution in the three-week forecast resembles a positive PNA pattern.”
Long-range Forecasting and Climate Indices
The phases of the various climate indices display differing degrees of persistence. The persistence of a pattern provides valuable predictability in both the subseasonal and seasonal forecast timeframes.
SST-based climate indices persist much longer than atmospheric climate indices because ocean circulation is relatively slow compared to the atmosphere. For example, in Figure 3 we see that the Pacific Decadal Oscillation switched from warm to cool at the end of 2019 and that this transition lasted for many months.
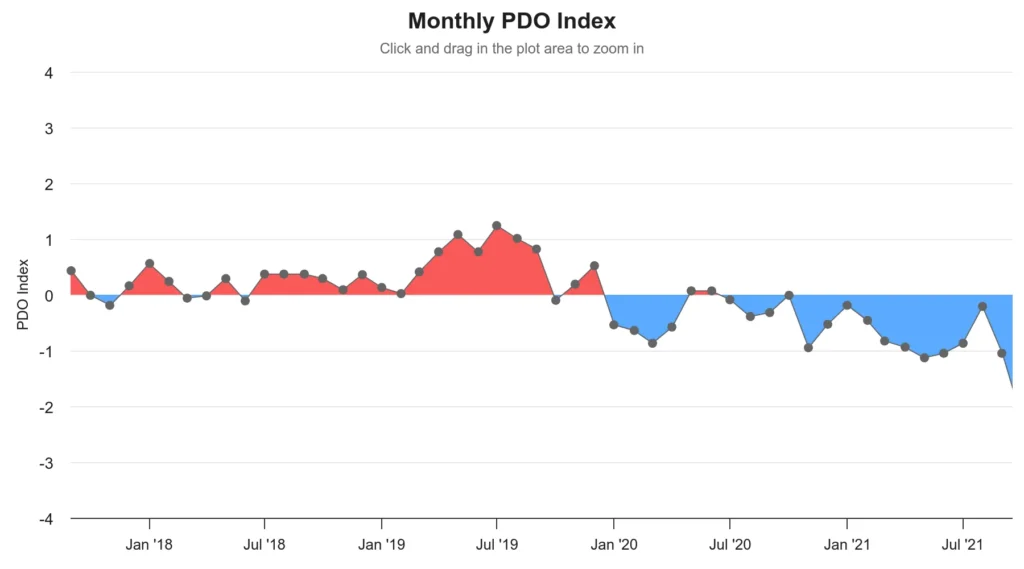
Fig. 3: Evolution of the Pacific Decadal Oscillation over a three year period
In contrast, the Arctic Oscillation (Figure 4) varies almost monthly and is much more variable than the oceanic PDO. However, despite the apparent volatility of the AO, the AO can get locked into a favored phase for weeks to months providing important predictive skill across both seasonal and subseasonal forecast horizons.
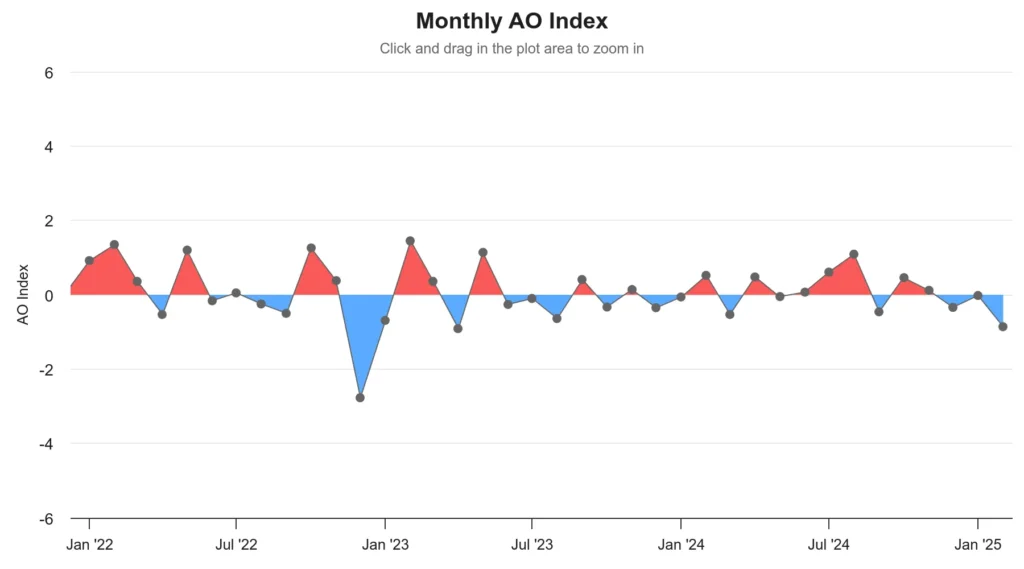
Fig. 4: Evolution of the Arctic Oscillation over a three year period
Climate Index Forecasting: The World Climate Service
The World Climate Service was developed to help meteorologists and energy traders easily manage and understand weather data. In addition to dynamical ensemble modeling, the use of climate indices in analog forecasting plays a valuable and essential role in medium-range and subseasonal, and seasonal climate forecasting.
Subscribers to the World Climate Service are able to monitor all of the important climate indices which are updated on a daily basis. Secondly, all of the major subseasonal model forecasts are presented in terms of each of the climate indices. This enables users to instantly understand the state of the climate and the likely impacts on the weather across all regions of the globe.
Finally, the World Climate Service includes a unique and powerful analog system which enables users to generate with just a few clicks, analog maps for all weather variables, which show what happened historically when given climate indices were in particular phases.
What is a Climate Index: Conclusion
A climate index describes a weather see-saw that occurs in a particular part of the world. Most of the climate indices are found in the atmosphere or in sea surface temperatures. Climate indices can persist from days to years, which makes them excellent tools for long-range forecasting. Climate indices also provide a convenient way to describe weather patterns over large areas.
The World climate Service includes a wealth of features which help subscribers track, forecast, and understand the impacts of all major climate indices.