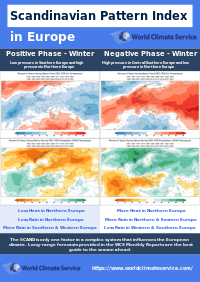
The Scandinavian Pattern (often referred to as the SCAND and/or the Scandinavian index) has important impacts on European weather and can be useful in long-range subseasonal weather prediction.
What is the Scandinavian Pattern Climate Index (SCAND)?
The Scandinavian Pattern climate index is an atmospheric climate index (climate cycle or teleconnection) that describes flow patterns over Europe. The Scandinavian index shapes the weather across Europe with characteristic patterns in evidence at different times of the year, making it a valuable input for long-range forecasters such as energy meteorologists. See how the European or Scandinavian Blocking weather regime best matches with the Scandinavia pattern here!

In this discussion, we use the analog forecasting tools available in the World Climate Service to understand the impacts of different phases of the Scandinavian index on European summer and winter weather. Check out and click on the Scandinavian Pattern Index (SCAND) quick summary PDFs for:
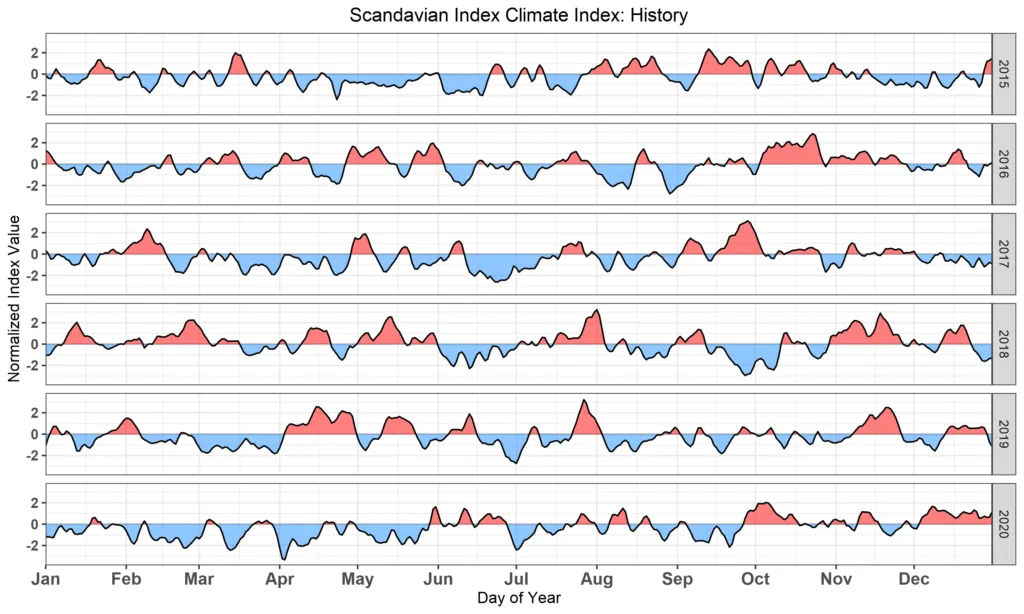
Like most climate indices, the Scandinavian index has positive and negative phases with a particular time scale of variations. The progression of the last five years of the Scandinavian index is shown below.
What is the Current Value of the Scandinavian Pattern Climate Index (SCAND)?
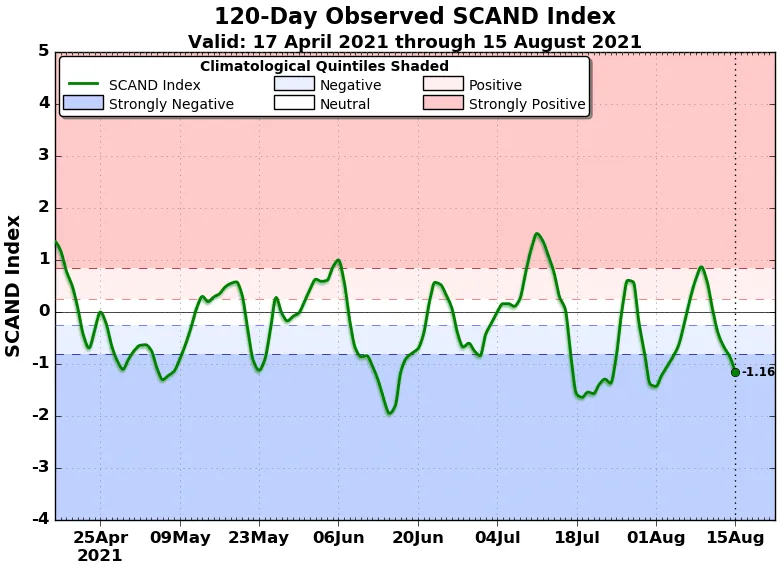
The current value of the SCAND is shown in Figure 2 from the World Climate Service.

Scandinavian Pattern – Positive Phase
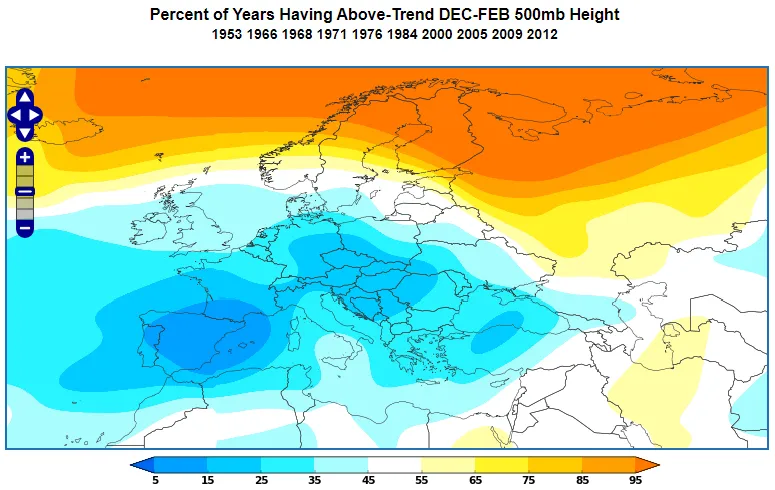
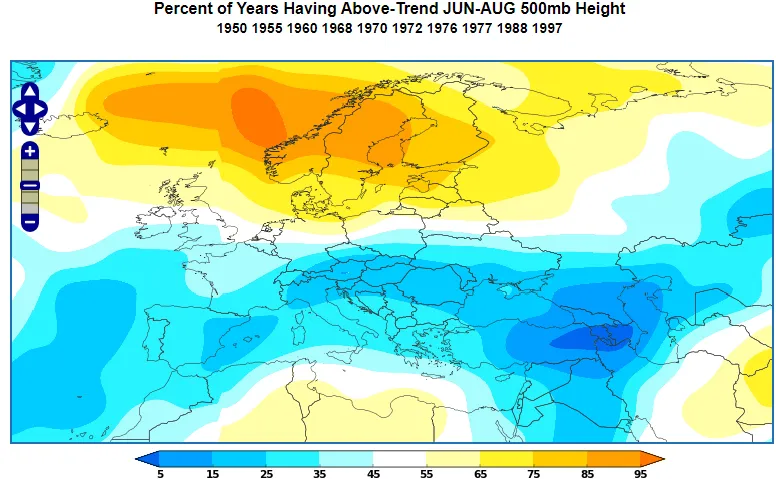
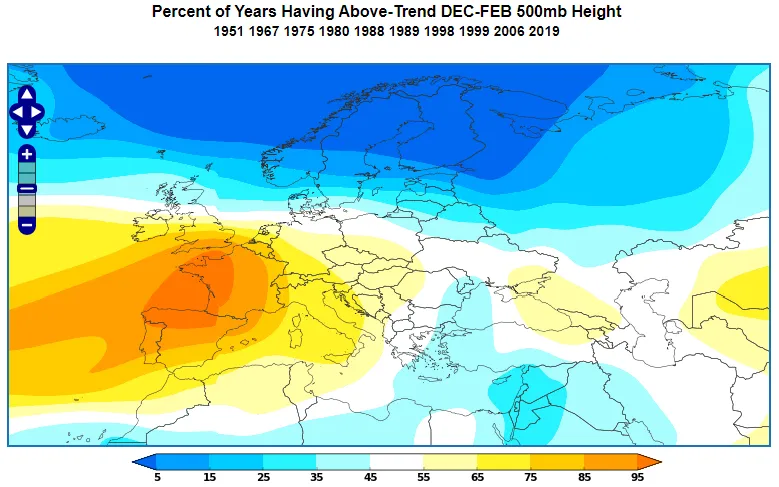
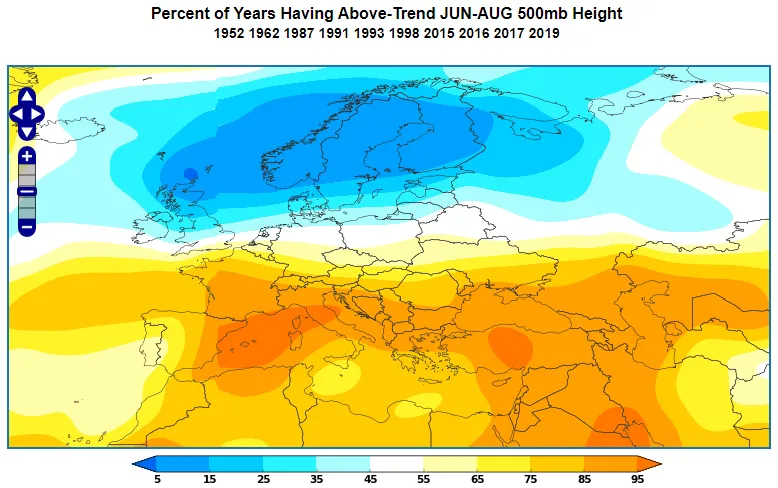
The Scandinavian index is largely driven by a pressure dipole between Southern Europe and Scandinavia. The World Climate Service 500 mb anomaly maps (Figures 3 and 4) show that a positive Scandinavian index occurs when southern Europe experiences low pressure while northern Europe experiences higher pressures.
Scandinavian Pattern – European Winter Positive Phase Impacts
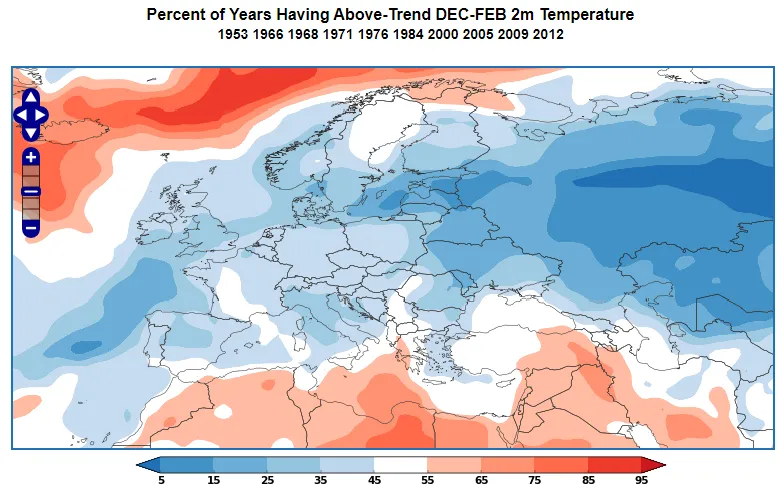
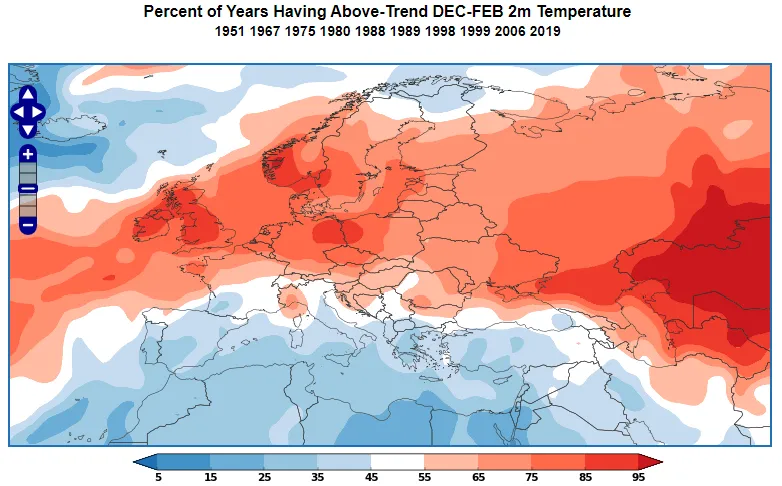
During the positive phase of the Scandinavian index in the wintertime, much of Europe is likely to be cooler than normal, especially in the Northeast (Figure 5).
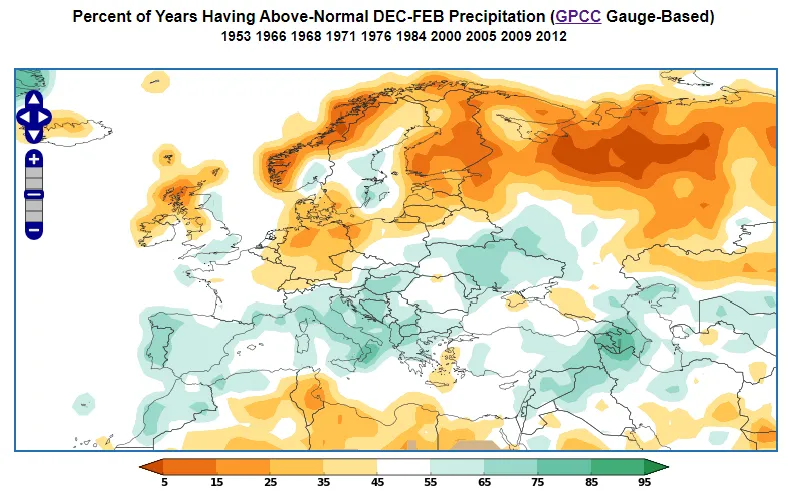
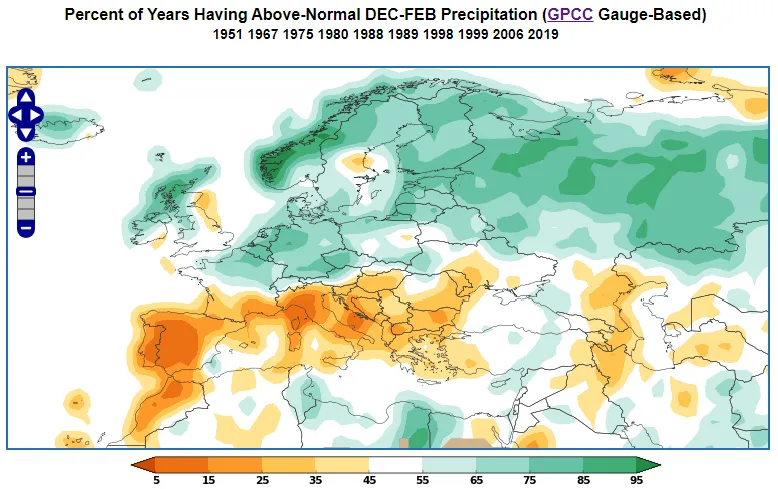
At the same time, Northern Europe is likely to be drier than normal, while the South and parts of Eastern Europe, are more likely to be wetter than normal (Figure 6).
Scandinavian Index – European Summer Positive Phase Impacts
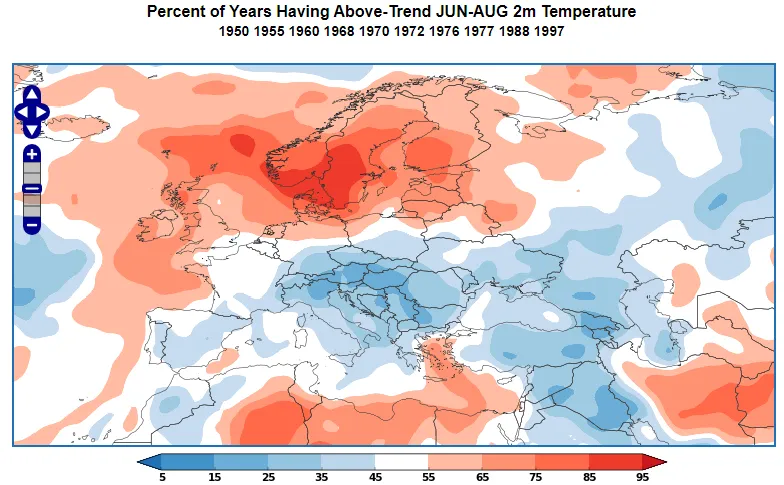
During the positive phase of the Scandinavian index in the summertime, Northern Europe is usually warmer than normal, while much of Southern Europe is likely to be cooler than normal (Figure 7).
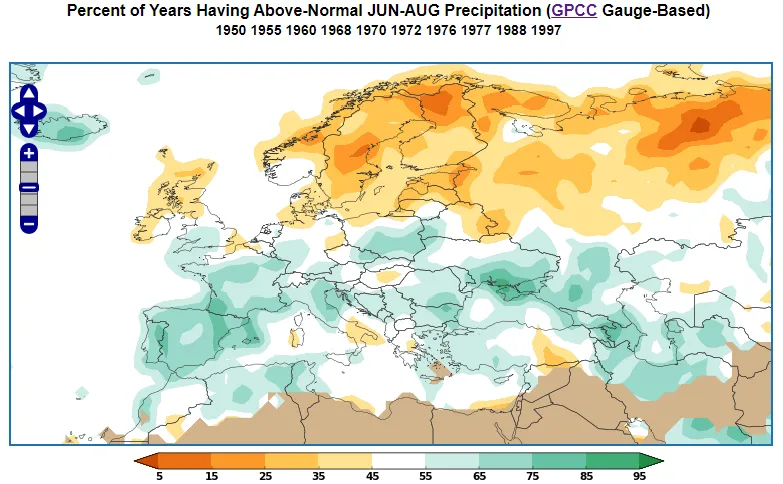
At the same time, Northern Europe is likely to be drier than normal, while the southern and central parts of Europe, are more likely to be wetter than normal (Figure 8).
Scandinavian Index – European Negative Phase
The negative phase of the Scandinavian index is nearly an inverse image of the summer-time positive phase, with low pressure centered over Northern Europe and high pressure across much of Central and Southern Europe. In winter we also see troughing in the Southeast.
Scandinavian Pattern– European Winter Negative Phase Impacts
During the negative phase of the Scandinavian index in wintertime, much of Central and Northern Europe is warmer than normal, but the south of Europe is usually cooler than normal (Figure 11).
At the same time, much of Northern Europe is wetter than normal, while the South is usually significantly drier than normal (Figure 12).
Scandinavian Pattern– European Summer Negative Phase Impacts
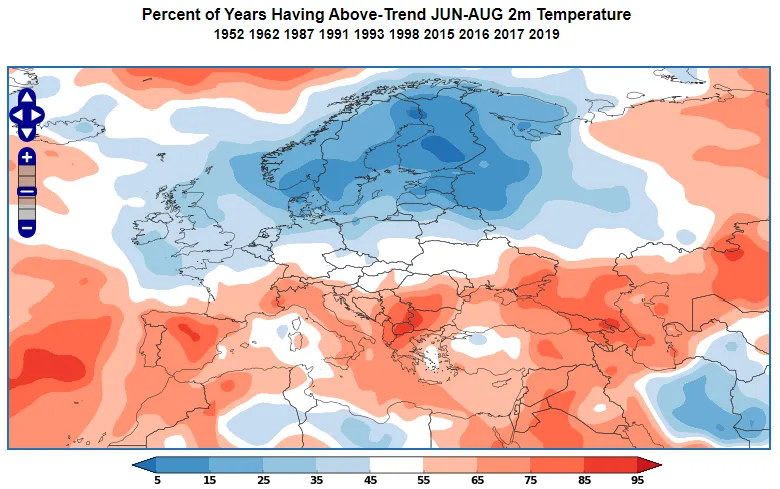
In the summertime when the Scandinavian index is negative we expect cooler than normal across Northern Europe, while the south of Europe is usually warmer than normal (Figure 13).
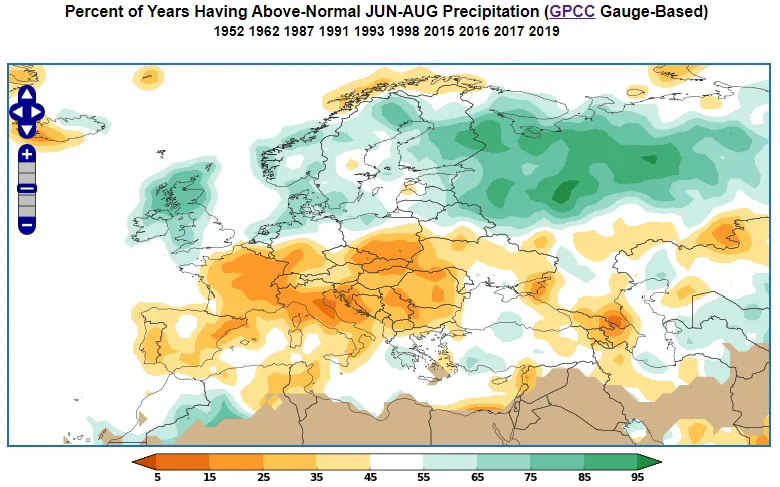
The summer rainfall pattern is similar to the winter pattern except that the dry weather extends further north into the North European Plain and wetter than normal weather is restricted to the northern tier (Figure 14).
The World Climate Service provides a powerful data mining capability that enables users to quickly explore the SCAND Climate Index, and many other indices, by phase for each month of the year, showing impacts on all the major weather parameters right around the globe.
What is the Scandinavian Pattern Climate Index – Long Range Forecasting
The Scandinavian Pattern Climate Index typically remains in a given phase from a few days to a few weeks. Thus the Scandinavian index is very much a subseasonal climate index (as opposed to a longer-lasting seasonal climate index such as ENSO). Occasionally the subseasonal forecast models will latch on to a high probability of one phase or the other with a two- or three-week lead time. If this expectation appears in several models, then forecasters start to consider what typically happens in the predicted Scandinavian index phase at that time of year.
What is the Scandinavian Pattern Climate Index – Conclusion
The Scandinavian Pattern climate index is a measure of the relative strength of the north-south pressure difference across Europe. The Scandinavian index is a subseasonal phenomenon that changes phases inconsistently and rarely persists in one phase for more than a week or two.
The Scandinavian pattern climate index is an important consideration in subseasonal forecasting because it indicates characteristic weather patterns over Europe that vary with time of year.