Historical Weather Forecast Archive
The World Climate Service and CropProphet have made it easier for commodity traders to win weather-based commodity trades. We’ve released a weather forecast archive containing an eight-year history of weather forecasts.
The product is called the Point-in-Time (PiT) Weather Forecast Archive API.
The data provided by the API enables systematic and discretionary commodity traders to:
- Trade forecast surprises by quantifying physical, futures, and options market responses to weather forecasts and their changes.
- Trade the forecast errors by evaluating recent and historical weather forecast performance.
- Trade forecast momentum by understand the chances of continued model changes in the same direction multiple times in a row.

The Weather Forecast Archive – Introduction
The weather forecast archive contains 00Z and 12Z daily resolution forecasts from the ECMWF Ensemble, NOAA’s Global Ensemble Forecast System (GEFS), and the NOAA’s Global Ensemble Forecast models (GFS). The API returns either the ensemble mean forecast or the forecast from each ensemble member.
Historical Weather Forecast Archive API
The original data is over 350 TB, making it difficult to transfer to users easily. We’ve converted the weather forecasts in the energy and agriculture commodity markets indices, enabling the data to be delivered via an application programming interface (API).
For example, we’ve calculated German wind speeds weighted by wind power capacity at 100 meters, U.S. corn production-weighted daily precipitation, maximum temperature, minimum temperature, and other agriculture, power, and gas market-relevant indices.
Real-time Commodity Market Weather Forecast API
The API also provides real-time 00Z and 12Z forecast updates for each model, region, market, and weighted variable.
Historical Weather Forecasts for Power Trading
The PiT Weather Forecast API provides power traders with eight years of weather forecast history for:
- US Independent System Operators. For example, review our analysis of ERCOT renewable power curtailment forecasts.
- US States with significant renewable power production
- European Transmission System Operators, including Nordic subregions and German TSO regions. For example, read our German wind power capacity factor forecasting analysis.
The power index values calculated include:
- Population-weighted daily maximum and minimum temperatures,
- Wind power capacity weighted 100m wind speeds,
- Solar power capacity is weighted by solar radiation.
The 2024 renewable power weighting applied is shown below.

Figure 1. The 2024 wind power capacity and solar power capacity weighting applied to the observed and forecast data.
Figure 2, below, shows a full history of 15-day forecasts from the ECMWF model. The graphic shows eight years of weather, Monday initialized 00Z forecasts.

Figure 2. Eight years of Monday 00Z initialized ECMWF German population-weighted daily average temperature forecasts.
We’ve published a case study of the impact of weather forecasts on Mont Belvieu propane prices.
Historical Weather Forecasts for Grain Trading
The PiT Weather Forecast API provides grain traders with eight years of weather forecast history for
- United States
- Canada
- Brazil
- Argentina
- Europe (all countries)
The variables include crop production weighted daily maximum temperature, daily minimum temperature, daily precipitation, and their “normal” (i.e., climatological average) values.
Crop production weighting – creating an index
The forecast information has been transformed into crop production-weighted indices. Below is an example of the US corn production weighting used to calculate the corn production-weighted forecast and observed variables.
When multiplied by the weather variable and summed to obtain the final statistic, the counties with deeper green colors receive a higher weight.
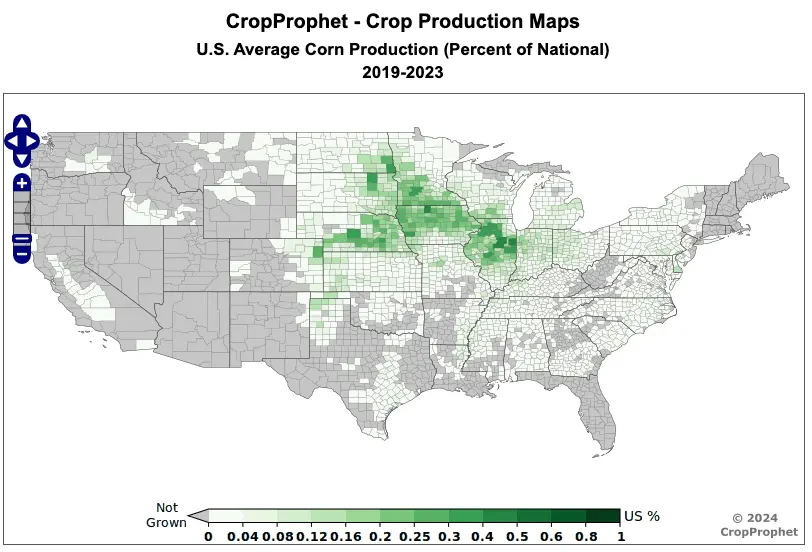
Figure 3. The US corn crop production weighting applied to the observational and forecast weather data.
The crop production weighted variables available for each country is shown in Table 1 below.
| Region | Crop Production Weighted Variable |
| United States | Barley
Corn Cotton Oats Rice Sorghum Spring Wheat |
| Canada | Barley
Canola Corn Oats Soybeans Spring Wheat Winter Wheat
|
| Brazil | Coffee
1st Season Corn Cotton Rice Sugarcane |
| Argentina | Barley
Corn Sorghum Soybeans Sunflower Wheat |
| Europe (by country) | Corn
Oats Rye Sunflower Winter Barley Winter Rapeseed Winter Wheat |
Table 1. The crops for which crop production weighted indices are available.
Summary
The Point-in-Time Weather Forecast API gives commodity traders (energy and agriculture) a decisive edge by unlocking eight years of historical weather forecast data—transformed into trade-ready indices. Whether you’re trading grain, energy, or other weather-sensitive products, the API helps you quantify market reactions to forecast surprises, analyze historical forecast errors, and capture forecast momentum. With region- and commodity-specific insights built for trading, this tool turns raw forecast data into actionable signals—so you can trade smarter, faster, and more confidently. Win more weather-based trades with the Point-in-Time Weather Forecast API.