ERCOT Renewable Curtailment Forecasting
Electric power networks curtail renewable power generation when there is a mismatch between supply and demand. Renewable power curtailment is the deliberate reduction or restriction of electric power generation from renewable energy sources, such as wind, solar, or hydro power that would otherwise be available to the grid due to operational, economic, or reliability constraints.
In power markets like ERCOT curtailment events create potential trading opportunities for power traders. These opportunities include:
- Nodal price arbitrage
- Virtual trading in the day-ahead market
- Congestion and forward market positioning.
However, to consistently capture these opportunities, traders need to anticipate when and where curtailment is likely to occur. Ideally these events can be forecasted days in advance.
This post provides an example of how to forecast renewable curtailment days in advance using archived power market weather forecasts for the ERCOT power market. The analysis shows how combining weather forecast data and historical curtailment data can produce a lead-time-aware curtailment signal useful in trading strategies.

ERCOT Power Market Weather Forecast Archive
Developing a renewable curtailment forecast begins with understanding how observed weather conditions (especially wind) relate to historical curtailment. ERCOT is an ideal testbed for this analysis because it provides publicly available curtailment data.
This study analyzes the relationship between archived weather forecasts available to traders and ERCOT’s renewable power curtailment history.
Prescient Weather’s Point-in-Time Weather Forecast API provides an 8-year archive of ECMWF, GEFS, and GFS forecasts, transformed into power-market-relevant indices. The weather forecasts used are “point-in-time” in that they are the actual forecasts the market received during the study period.
For example:
- ECMWF 100m wind speed grids are transformed into a ERCOT wind power capacity-weighted 100m wind speed index.
- Forecasts are available as both ensemble means and individual ensemble members, making both deterministic and probabilistic modeling possible.
- The forecasts are accompanied by the corresponding observed values, facilitating forecast performance evaluation and weather impact analysis.
Figure 1 below shows a history of the ensemble mean daily ERCOT wind power capacity weighted 100m wind speeds from November 2022. A full history of 00Z and 12Z forecasts from 2017 to the present day is available in the API.
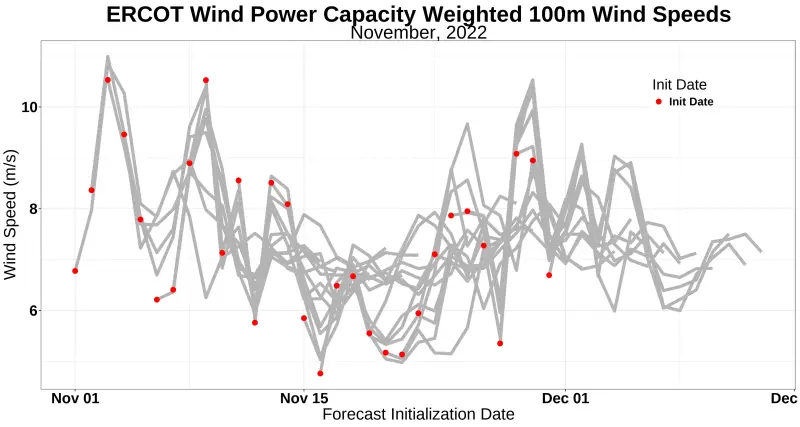
Figure 1. November 2022 ensemble mean ERCOT wind power capacity 100m wind speed forecasts. The red dots indicate each 00Z initialization date/time.
ERCOT Renewable Curtailment Forecast
We combine the above weather data with ERCOT’s security-constrained economic dispatch (SCED) data to build the forecast model. With simple preprocessing, this data allows us to compute daily total renewable curtailment.
Figure 2 demonstrates curtailment’s impact on solar power utilization. The grey dots show daily solar power capacity utilization, while the red dots represent the hypothetical utilization without curtailment. Solar power capacity utilization, which is reported by ERCOT, is shown because it accounts for the gradual increases in the nameplate renewable power generation capacity that occurs over time. It indicates the fraction of the total power capacity used to generate power from the renewable resource.
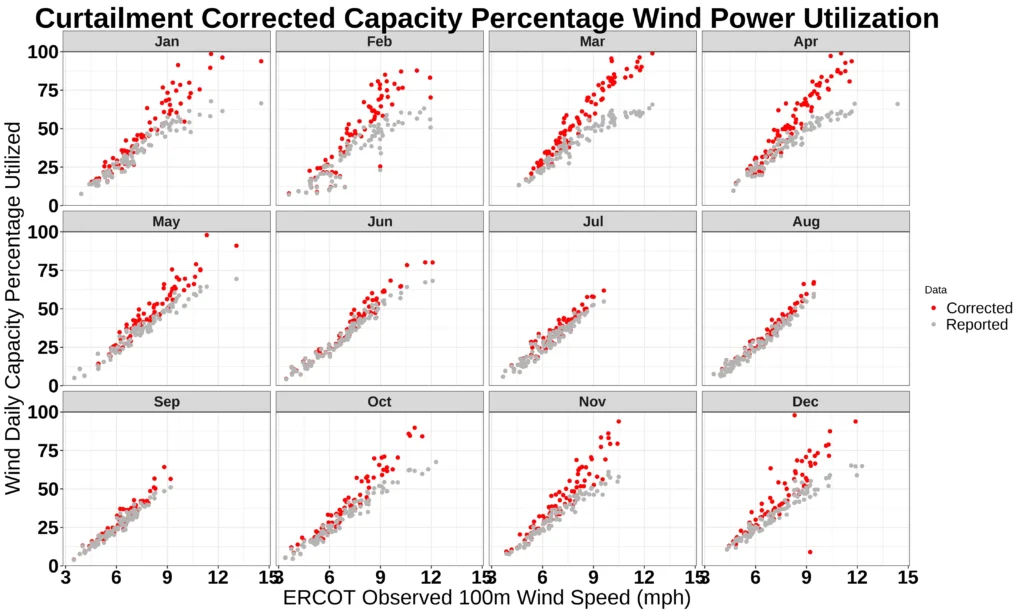
Figure 2. A comparison between daily ERCOT solar power capacity utilization (grey dots) and the total possible solar power capacity utilization (red dots) by month of the year. The difference between each day’s value is solar power curtailment.
This seasonal pattern reveals that curtailment is most common in spring and fall when renewable generation is high, but system demand can be low.
Renewable Power Curtailment Forecast by Lead Time
By combining ERCOT’s daily curtailment data with lead-time-separated wind forecasts (0 to 13 day lead time), we assess how well the ECMWF model predicts curtailment.
Figure 3 shows a strong relationship between wind forecasts and curtailment at short leads (e.g., 1–3 days), but this relationship weakens as lead time increases.
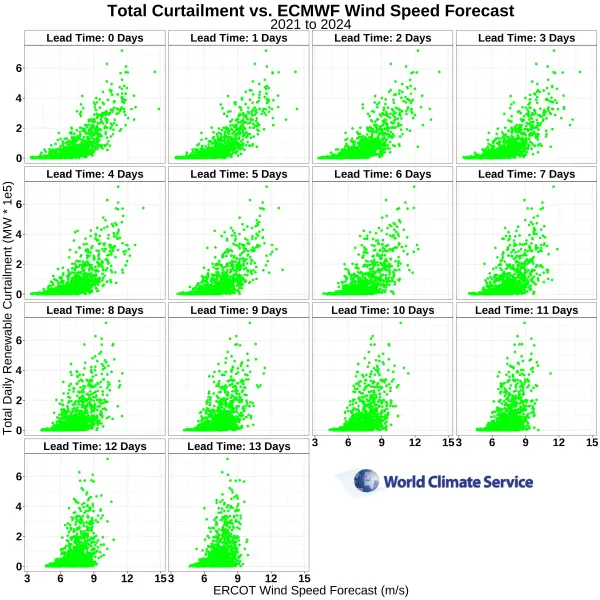
Figure 3. Total daily renewable power ERCOT curtailment vs ECMWF forecasted daily average wind speed by lead time.
A trader leveraging this insight can identify:
- Which lead times still carry predictive power
- When the forecast signal has decayed and should no longer influence trading decisions
Significantly, as seen in Figure 2, curtailment magnitude also varies by season. A well-constructed trading model must account for this seasonal variation.
Renewable Power Curtailment Forecast by Lead Time and Month of Year
We segment the curtailment vs. wind forecast relationship by month and lead time to build a seasonally aware, forecast lead-time dependent curtailment forecast. The result is shown in Figure 4.
A full-size image of Figure 4 is available here.
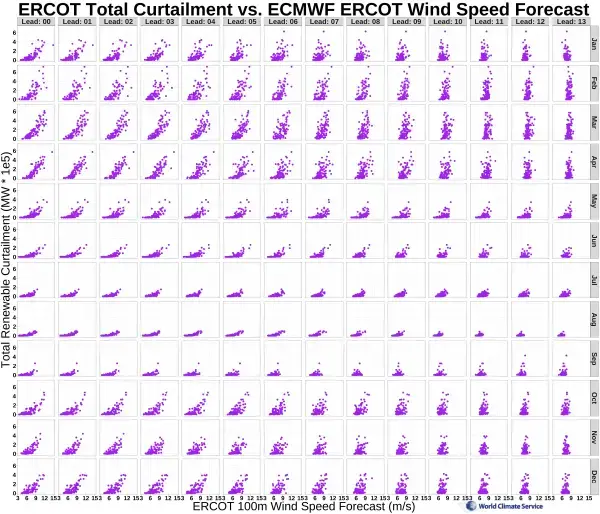
Figure 4. The relationship between the ECMWF ERCOT daily averaged 100m wind speed forecast and renewable power curtailment by lead time (across the image) and month of the year (down the image).
This analysis confirms that ERCOT renewable curtailment is predictable and that both the time of year and forecast horizon are critical to modeling curtailment risk effectively.
Traders can use these results to:
- Build regression or classification models that predict curtailment probability
- Incorporate curtailment into locational marginal pricing (LMP) models, improving predictions of price suppression or congestion
- Enhance transmission congestion models by forecasting when and where renewables will be curtailed
ERCOT Curtailment Model Fit Example
To demonstrate how a simple model might be implemented, we fit a quadratic regression between the two-day lead forecasted wind speed and observed curtailment for April.
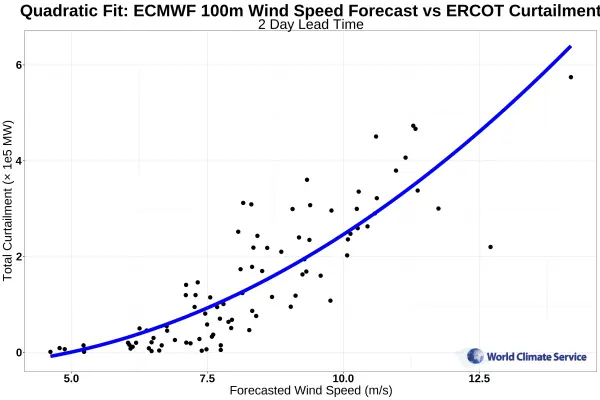
Figure 5. An example quadratic polynomial fit between the ERCOT ECMWF daily averaged 100m wind speed two-day forecast and ERCOT renewable power curtailment.
Once this fit is established, traders can use ensemble forecast members to generate a probabilistic curtailment forecast. By applying the quadratic model to all 51 ECMWF ensemble members’ forecasts of the ERCOT 100 m wind speeds, a histogram of possible curtailment outcomes two days in advance is created.
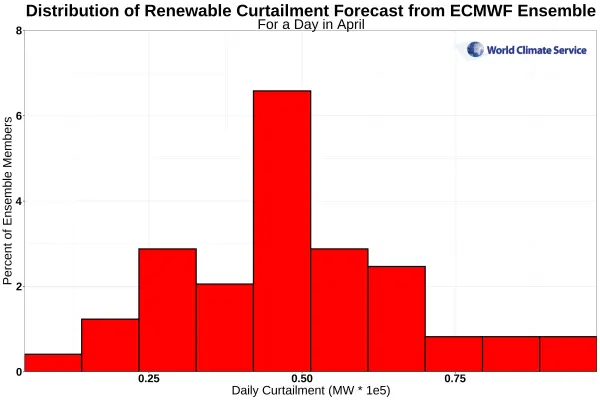
Figure 6. A hypothetical two-day lead time forecast of ERCOT daily renewable power curtailment from the ECMWF ensemble forecast of EROCT 100m wind speeds.
This probabilistic curtailment forecast can be directly linked to expected LMP behavior, giving traders a tool for:
- Identifying price risk and opportunity
- Timing congestion trades
- Structuring forward positions more effectively
Summary
ERCOT renewable curtailment is systematically linked to wind speed forecasts, and the signal is strongest at short lead times and in shoulder seasons.
Prescient Weather’s Point-in-Time Forecast archive, available via API, enables power traders to:
- Build data-driven curtailment forecasts
- Improve LMP and congestion model accuracy
- Win more trades based on forecast-driven insights
Whether you’re building regression models or ensemble-based probability forecasts, knowing when curtailment is coming — and how the market will respond — is a key edge in competitive power trading.
Another application of the weather forecast archive is forecasting Mount Belveiu propane prices.