The Southern Oscillation Index (SOI): Impacts, Phases, and Forecasting Insights
Introduction
The Southern Oscillation Index (SOI) serves as a critical indicator in understanding the atmospheric dynamics behind the El Niño–Southern Oscillation (ENSO) system, a dominant driver of global climate variability. By measuring the difference in air pressure between Darwin, Australia, and Tahiti, the SOI provides a window into the strength and behavior of the Walker Circulation, an atmospheric loop that significantly shapes weather patterns worldwide. Check out and click on the Southern Oscillation Index (SOI) quick summary PDFs for the:
Positive SOI values align with La Niña events, characterized by intensified trade winds and cooler-than-normal sea surface temperatures (SSTs) in the eastern Pacific (Figure 1). Negative SOI values signal El Niño conditions, marked by weaker trade winds and warmer-than-normal SSTs in the eastern Pacific. These opposing phases influence global weather phenomena, from altered rainfall patterns to shifts in tropical cyclone activity.
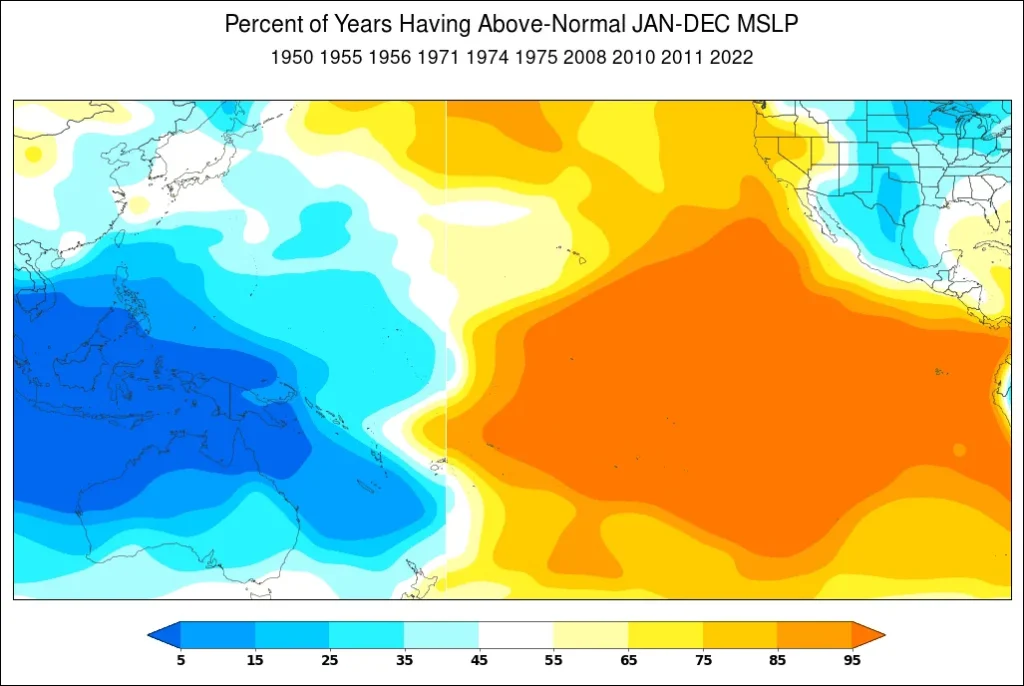
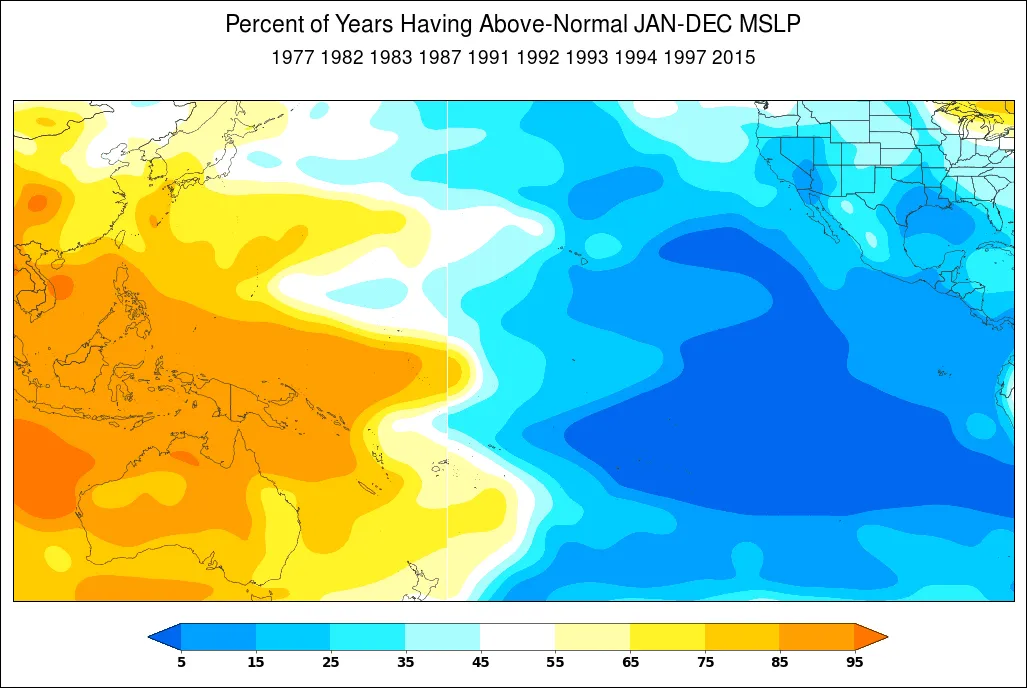
Figure 1. World Climate Service climate index analogs tool showing the percent of years having above-normal January through December mean-sea level pressure during a strongly positive SOI (top) and the percent of years having above-normal January through December mean-sea level pressure during a strongly negative SOI (bottom). In La Niña conditions (positive SOI), pressure is above normal (orange) over the central Pacific near Tahiti and below average (blue) over Australia. In El Niño conditions (negative SOI), these anomalies are reversed.
Between December 2022 and February 2023, a strongly positive Southern Oscillation Index (SOI) signaled the presence of La Niña, which had widespread global impacts on agriculture, particularly in Argentina. According to The Star, Argentina experienced its driest year since 2008, primarily due to persistent La Niña conditions (Braun, 2023). This extended drought severely affected the agricultural sector, with corn and soybean production suffering notable losses. Soybean production, in particular, endured its worst season in 23 years (Chiummiento, 2023). During periods of a strongly positive SOI, as observed in December through February 2022–2023, Argentina faces very low probabilities of above-normal precipitation. Figure 2, based on the World Climate Service ERA5 Reanalysis product, illustrates the significantly low precipitation totals during this timeframe, with some regions receiving as little as 25 percent of normal precipitation levels.
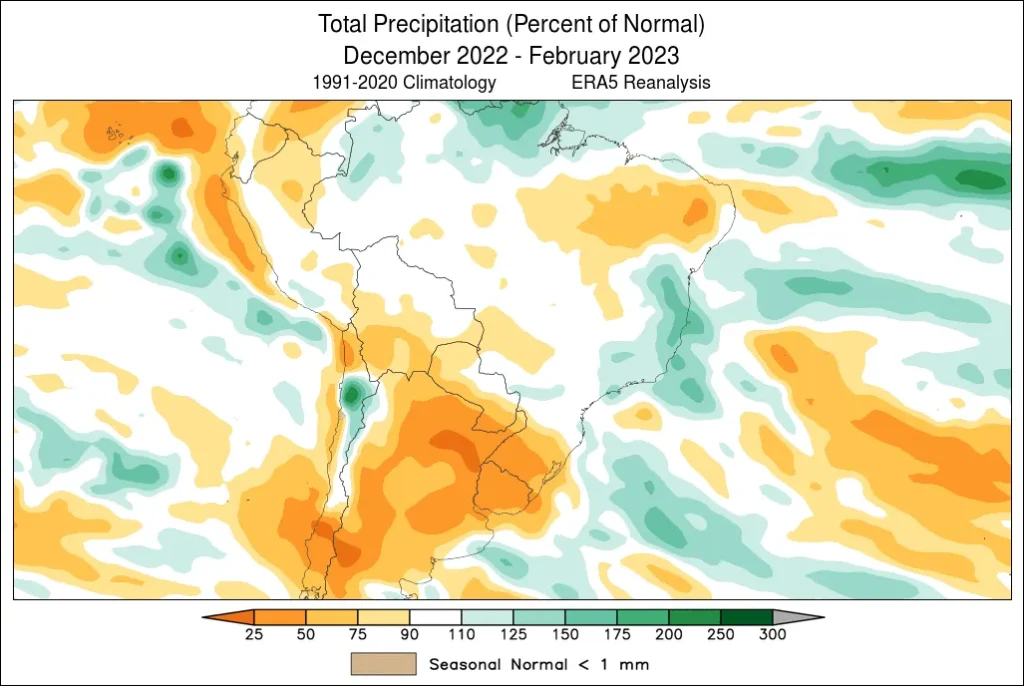
Figure 2. World Climate Service ERA5 reanalysis product showing the December 2022 – February 2023 total precipitation in percent of normal, specifically highlighting the dry correlation in Argentina.
CropProphet’s final 2023 corn and soybean forecast deviation from trend graphics (Figure 3 and Figure 4) reveal that both crops experienced yields below trend, likely influenced by the positive SOI (La Niña) conditions observed from December 2022 to February 2023. During the 2023 crop year, Argentina’s corn yield deviation from trend was -2.47 metric tons per hectare, while soybeans showed a deviation of -0.94 metric tons per hectare.
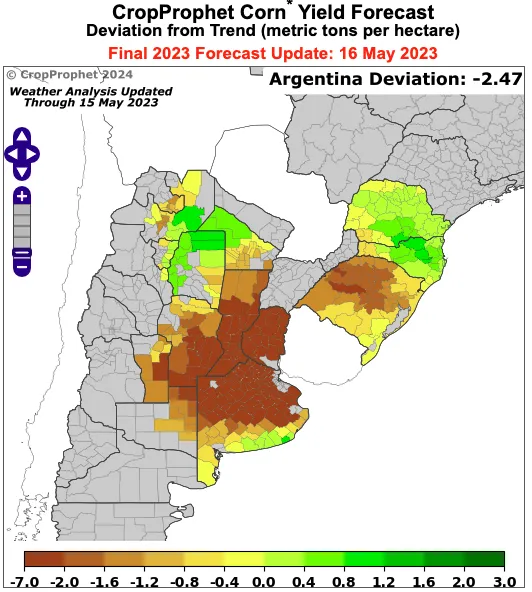
Figure 3. CropProphet corn yield Argentina forecast deviation from trend (metric tons per hectare).
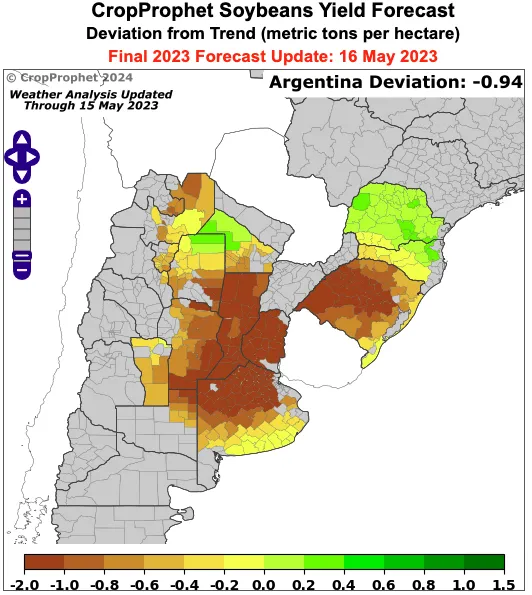
Figure 4. CropProphet soybeans yield Argentina forecast deviation from trend (metric tons per hectare).
Understanding the SOI is vital for long-range weather forecasting, particularly for industries like agriculture, energy, and disaster preparedness. The World Climate Service provides an opportunity to understand the impact of a multitude of climate indices by enabling intercomparison of the impact of the SOI with other climate indices, such as the Arctic Oscillation (AO), Tropical North Atlantic Index (TNA), and Indian Ocean Dipole (IOD), creating a comprehensive framework for forecasting.
What is the Southern Oscillation Index (SOI)?
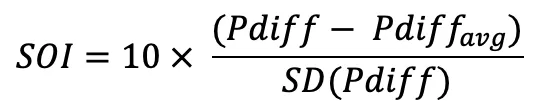
As previously stated, the SOI is calculated by comparing air pressure anomalies between Darwin, Australia, in the western Pacific, and Tahiti, in the central Pacific. This calculation is represented by the equation below (Equation 1). In equation 1, Pdiff is the observed pressure difference between Tahiti and Darwin. Pdiffavg is the long-term average of the pressure differences. Lastly, SD(Pdiff) is the standard deviation of the pressure difference.
This standardized calculation allows for identifying ENSO phases, enabling meteorologists and decision-makers to predict climate conditions with confidence. Figure 5 from the World Climate Service illustrates the daily SOI index from 2010 through 2024, showcasing real-time fluctuations and trends.
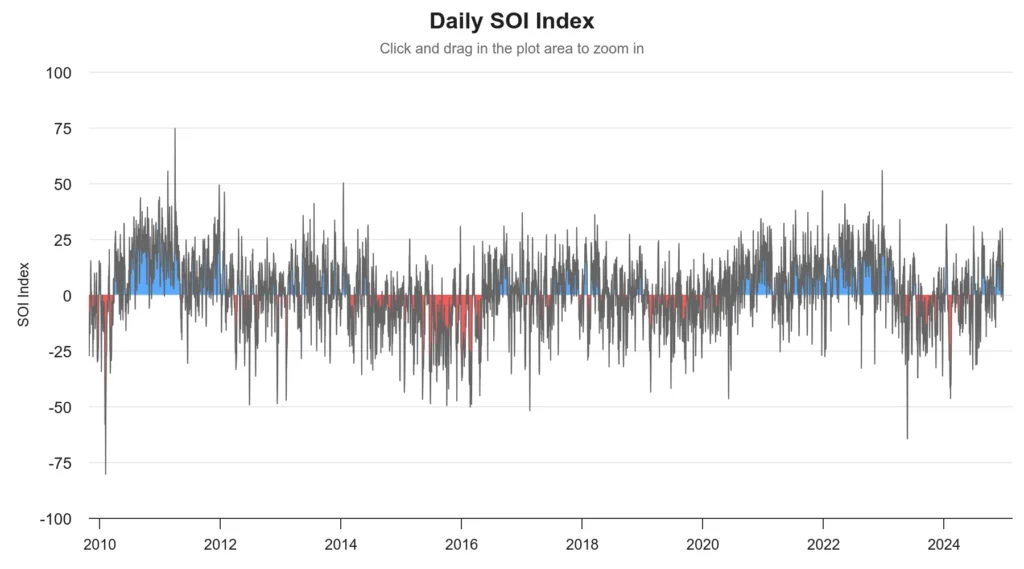
Figure 5. Represents the daily SOI index chart from 2010 through 2024 that is provided by the World Climate Service.
What is the Current Value of the Southern Oscillation Index (SOI)?
The current value of the Southern Oscillation Index (SOI) is displayed in Figure 37.
Figure 6. Daily SOI index (auto-updates at 12:00 PM ET).
SOI Phases and Their Impacts
Negative SOI (El Niño):
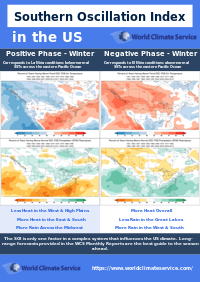
A negative SOI corresponds to El Niño conditions. This phase often brings wetter conditions to the southern United States and drier weather to Australia and Southeast Asia. Figure 7 shows the percent of the year that had an above-trend June through August sea surface temperatures (SSTs) during a strongly negative SOI from the World Climate Service. As one can see, a negative SOI shows a significant likelihood of above-normal SSTs across the eastern Pacific Ocean showcasing El Niño conditions.
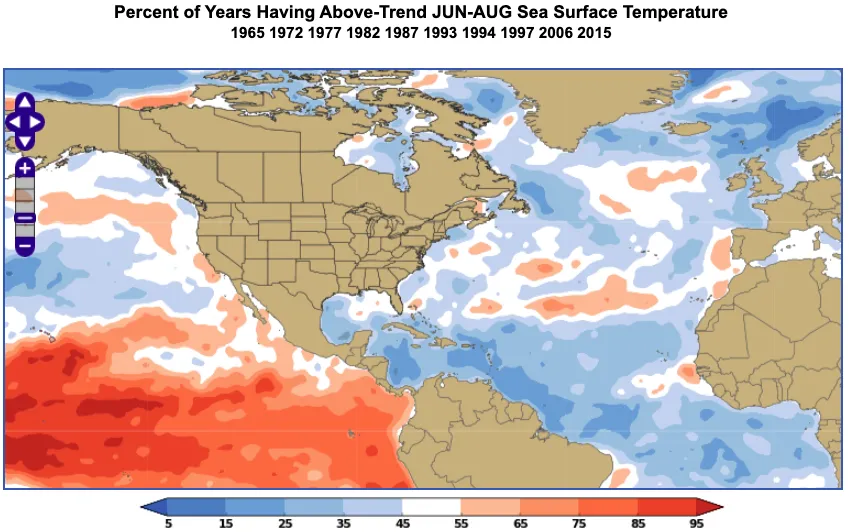
Figure 7. An example of the World Climate Service climate index analogs tool showing the percent of years having above-trend June through August sea surface temperature (SST) during a strongly negative SOI.
Figure 8 shows the percent of years with an above-trend June through August 2-meter temperature during a negative SOI across the United States. During a negative SOI, the majority of the US shows an increased likelihood of below normal 2-meter temperatures. Additionally, Figure 9 highlights the percentage of years with above-normal precipitation from June through August during a negative SOI in the United States. Across the central US, there is a significant probability of below-normal rainfall. However, there is a substantially low probability of above-normal precipitation in the Pacific Northwest during a negative SOI.
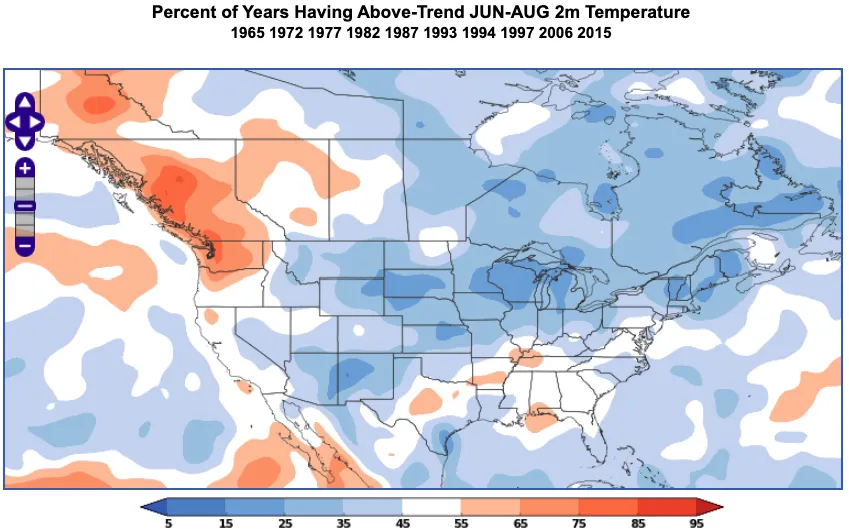
Figure 8. An example of the World Climate Service climate index analogs tool showing the percent of years having above-trend June through August 2-meter temperature during a strongly negative SOI.
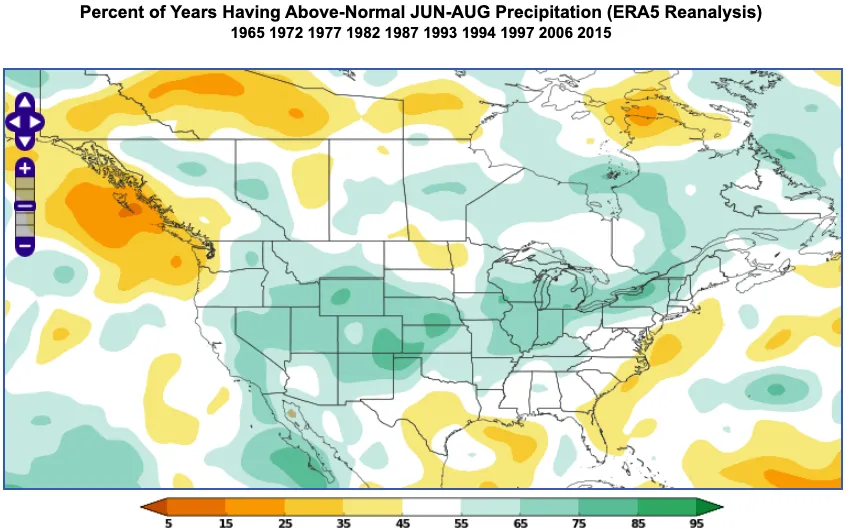
Figure 9. An example of the World Climate Service climate index analogs tool showing the percent of years having above-normal June through August precipitation during a strongly negative SOI.
Positive SOI (La Niña):
A positive SOI relates to La Niña conditions. This phase typically results in wetter conditions in Australia and Southeast Asia and drier conditions in the southern United States. Figure 10 displays the percent of years having above-trend June through August SSTs during a strongly positive SOI. A La Niña corresponds to below-normal SSTs in the eastern Pacific; what one sees here is the same. A strongly positive SOI shows a low probability of above-normal June through August SSTs in the eastern Pacific Ocean.
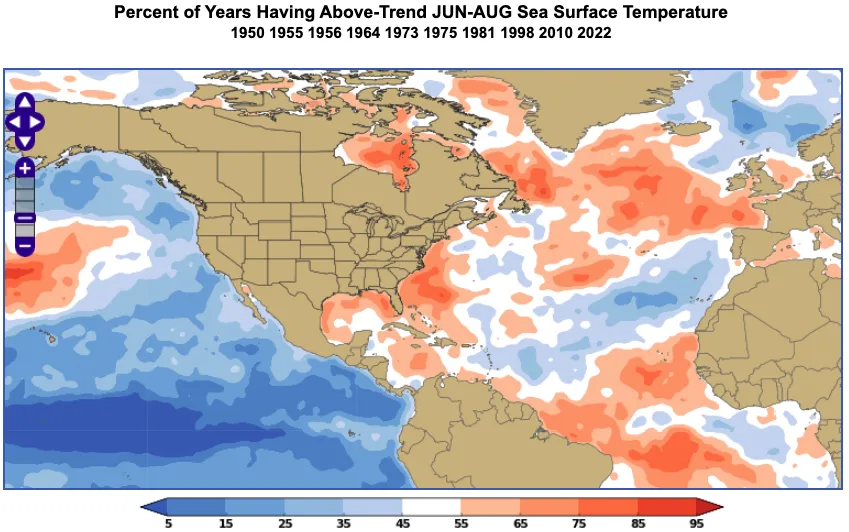
Figure 10. An example of the World Climate Service climate index analogs tool showing the percent of years having above-trend June through August sea surface temperature (SST) during a strongly positive SOI.
Figure 11 highlights the percent of years having above-trend June through August 2-meter Temperatures in the United States during a strongly positive SOI. This graphic signifies that there is an increased likelihood of above-normal temperatures across the central and eastern portions of the US as well as extreme probabilities in north-central Canada.
On the other hand, there are very low probabilities that the Rocky Mountains and the west will have temperatures above normal. Figure 12 displays the percent of years having above-normal June through August precipitation during a strongly positive SOI. Across the southeast, especially Florida, there are very low probabilities of above-normal precipitation occurring in that region during a strongly positive SOI in June, July, or August. The same could be said in much of California. Conversely, the Pacific Northwest, especially Washington and Idaho, show significant probabilities of having above-normal June through August precipitation during a strongly positive SOI.
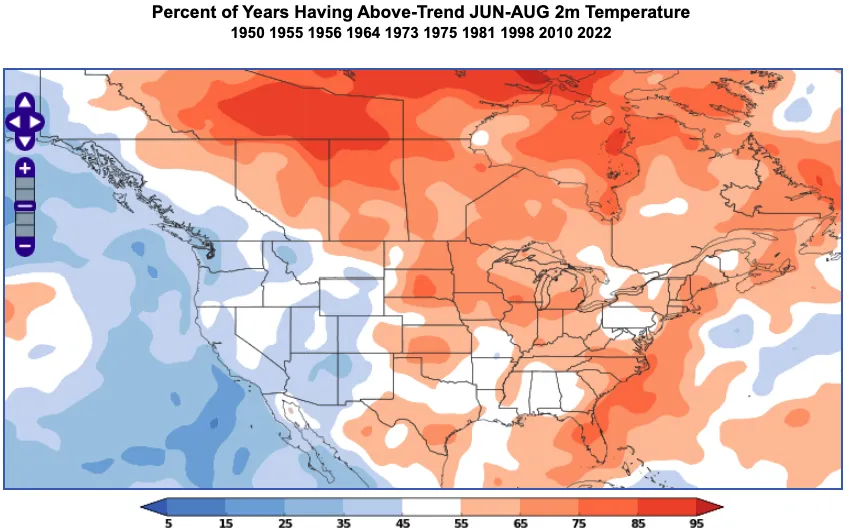
Figure 11. An example of the World Climate Service climate index analogs tool showing the percent of years having above-trend June through August 2-meter temperature during a strongly positive SOI.
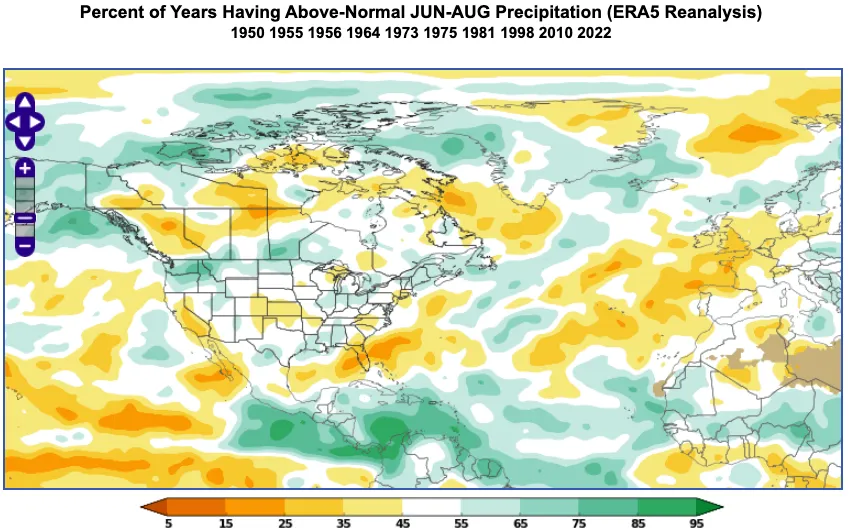
Figure 12. An example of the World Climate Service climate index analogs tool showing the percent of years having above-trend June through August precipitation during a strongly positive SOI.
Neutral SOI:
Neutral SOI phases act as transitional states with no dominant ENSO influence. Figure 13 portrays the percent of years having above-trend June through August sea surface temperatures during a nearly neutral SOI. During a nearly neutral SOI, there is a very low likelihood of above-normal June, July, and August SSTs across the eastern Pacific Ocean. This figure also highlights an increased likelihood of above-normal June through August SSTs.
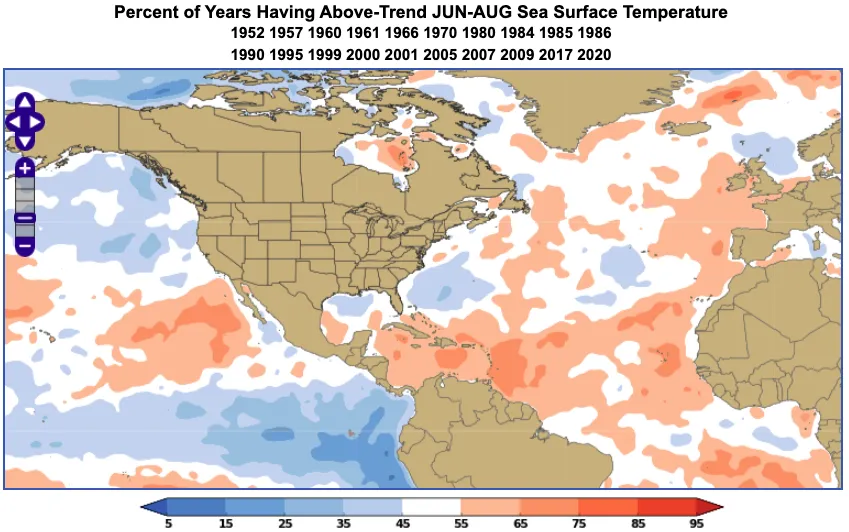
Figure 13. An example of the World Climate Service climate index analogs tool showing the percent of years having above-trend June through August sea surface temperature (SST) during a nearly neutral SOI.
In Figure 14, showing the percent of years having above-trend June through August 2-meter Temperature during a nearly neutral SOI, highlights a strong probability of above-normal t2m2-meter temperature across the vast portions of the central US.
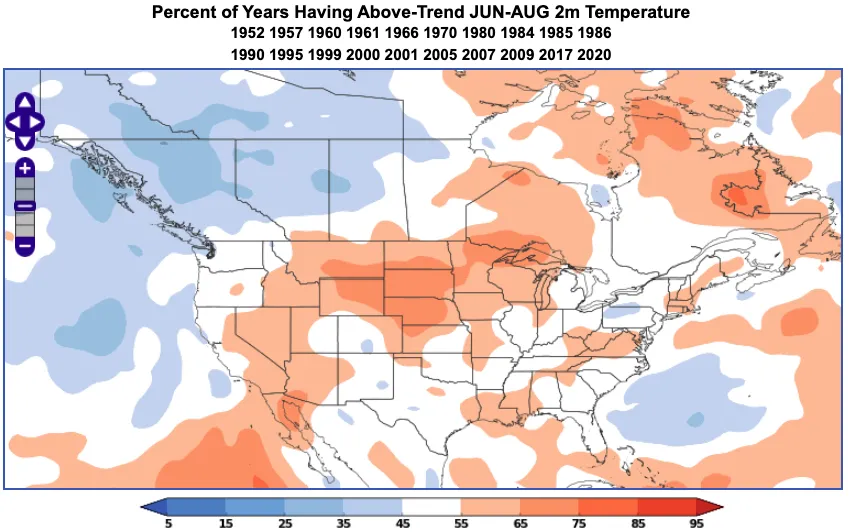
Figure 14. An example of the World Climate Service climate index analogs tool showing the percent of years having above-trend June through August 2-meter temperature during a nearly neutral SOI.
Next, Figure 15 shows the percent of years having above-normal June through August precipitation during a nearly neutral SOI. This graphic shows an area of low probabilities of having above-normal June to August precipitation during a nearly neutral SOI extending from the central to northwest US. Additionally, there are more low probabilities in New England.
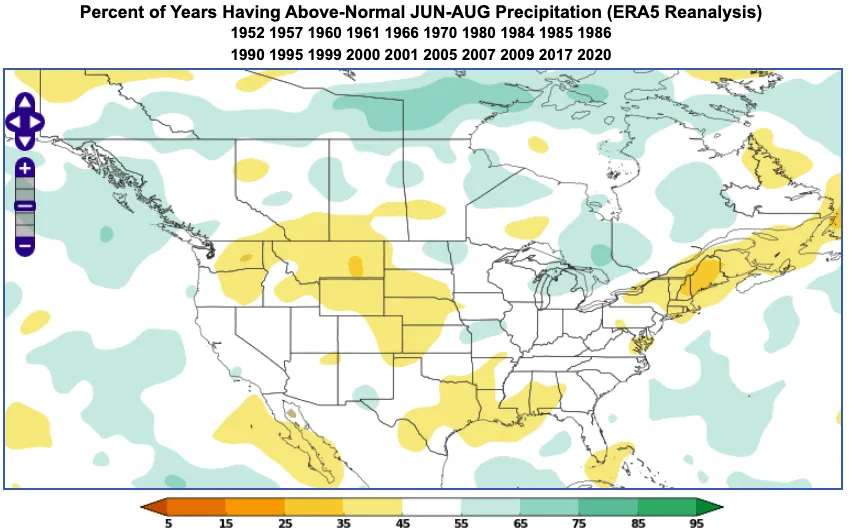
Figure 15. An example of the World Climate Service climate index analogs tool showing the percent of years having above-trend June through August precipitation during a nearly neutral SOI.
Case Studies and Examples
Strong positive SOI summer:
During the summer of 2022 (June through August), there was a strongly positive SOI (La Niña). What were the weather conditions such as the SST, t2m2-meter temperature , and precipitation like during that summer? Figure 16 shows the average SST anomaly (°C) in June 2022 through August 2022 using 1991-2020 climatology. This graphic lines up similarly to Figure 9. For example, both figures show increased likelihoods of below-normal SSTs in the eastern Pacific Ocean (where La Niña is situated and occurs) and increased likelihood of above-normal SSTs in the Gulf of Mexico.
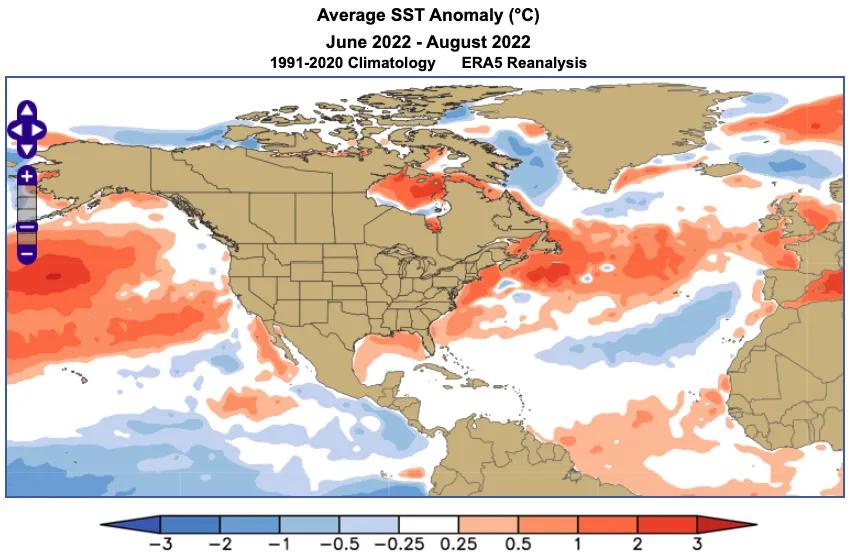
Figure 16. World Climate Service graphic that displays the June through August 2022 average SST anomaly (°C).
Figure 17 and Figure 18 also compare well to Figure 11 and Figure 12, respectively. For example, shows an increased likelihood of above-normal 2-meter temperatures across the central and northern United States and into Canada. In Figure 17, the June through August 2022 average 2-meter Temperature was shown to be above normal through the majority of the same regions, although a little more spread out across North America
In Figure 12, there is a hint of low probabilities of above-normal precipitation occurring across the central US. Figure 18 also shows that there were below normal/dry conditions in place across the central US during this time frame.
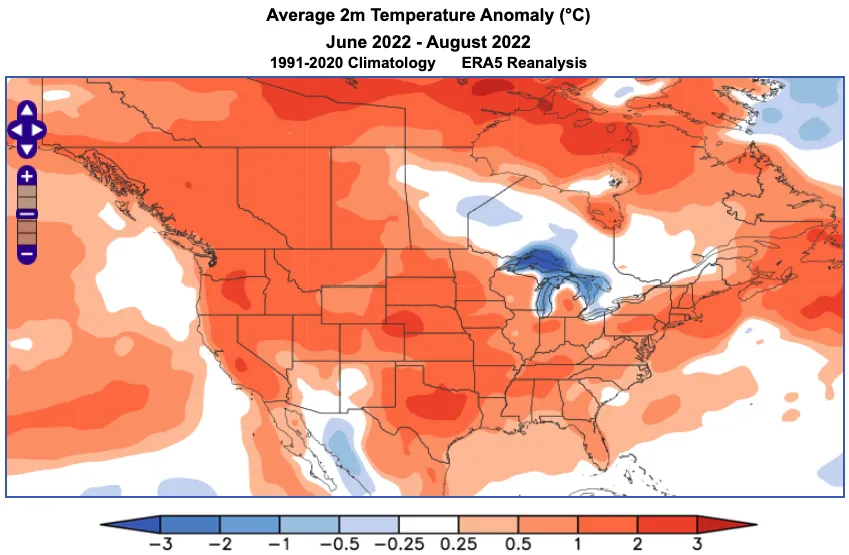
Figure 17. An example of a WCS graphic showing the June through August 2022 Average 2-meter temperature anomaly in °C using 1991-2020 climatology.
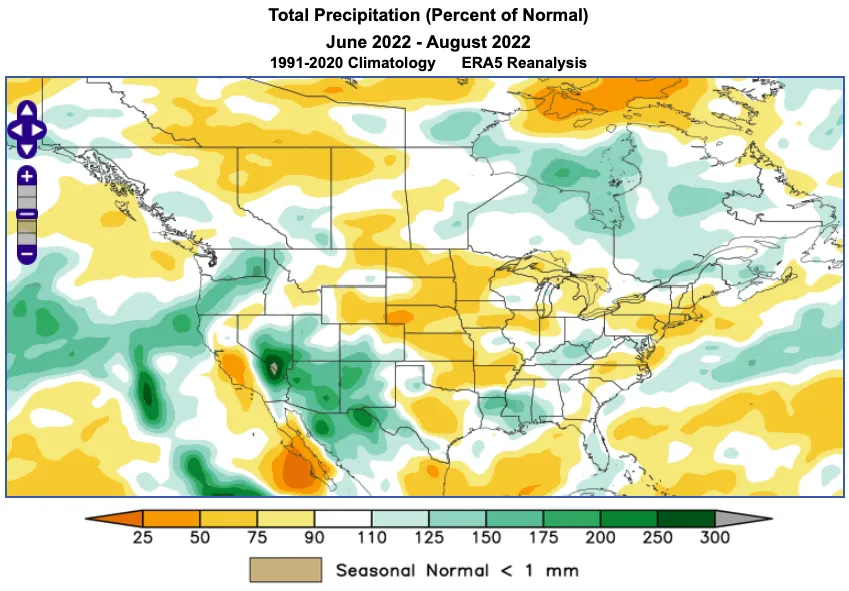
Figure 18. An example of a WCS graphic showing the June through August 2022 total precipitation (percent of normal) using 1991-2020 climatology.
Europe
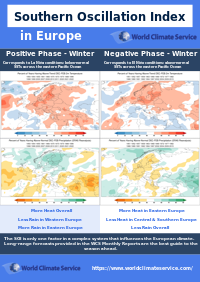
In Europe, during a strong positive SOI, the majority of Europe shows they have an increased likelihood of observing above-normal June through August 2-meter temperatures (Figure 19). Figure 20 shows that western and eastern Europe have low probabilities of receiving above-normal June through August precipitation during a strongly positive SOI.
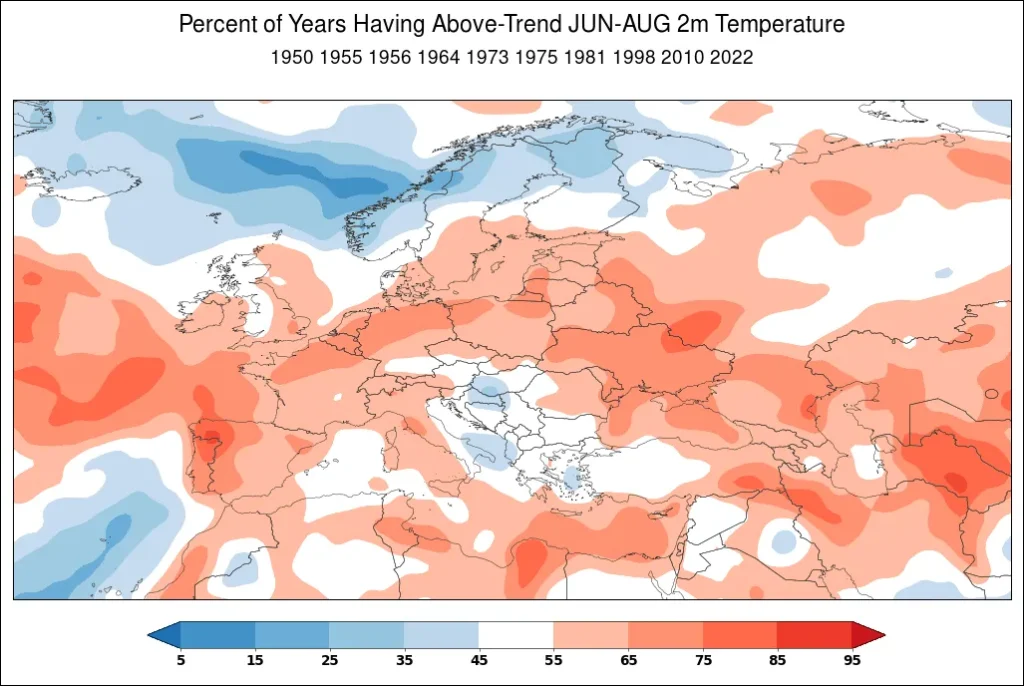
Figure 19. Percent of years having above-trend June through August 2-meter temperature in Europe during a strongly positive SOI.
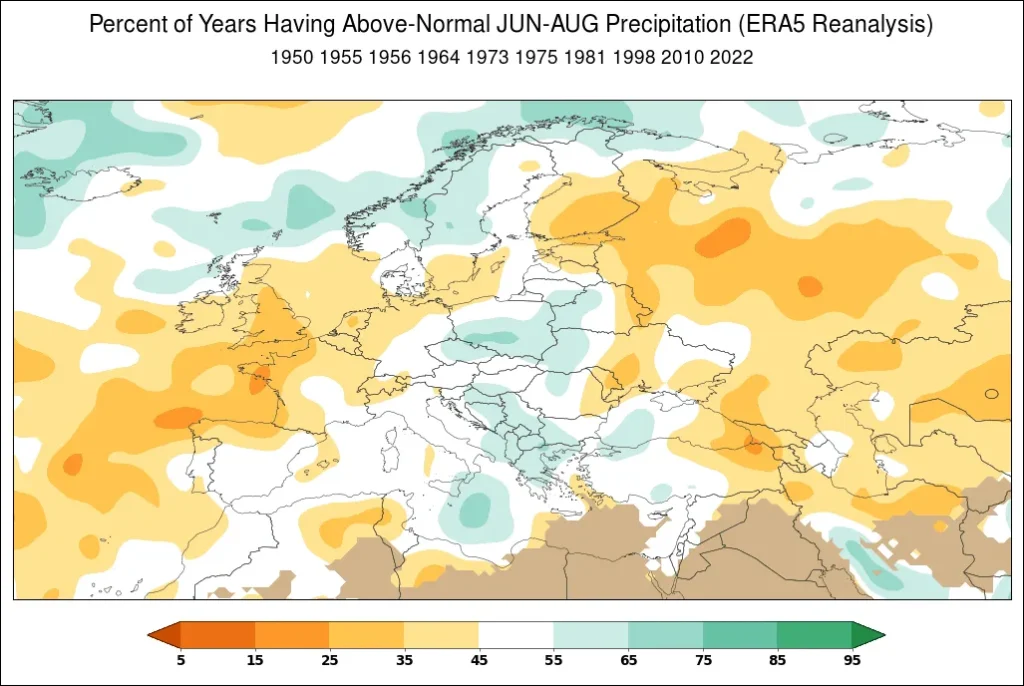
Figure 20. Percent of years having above-trend June through August precipitation in Europe during a strongly positive SOI.
Asia
In Asia during a strongly positive SOI, there is an increased likelihood of above-normal temperatures across the middle east through China and Japan (Figure 21). Figure 22 shows the percent of years having above-normal June through August precipitation during a strongly positive SOI. In this figure, there is an increased likelihood of above-normal June through August precipitation during a strongly positive SOI in Pakistan and India. Additionally, portions of the middle east are shown to have lower probabilities of observing above-normal June through August precipitation.
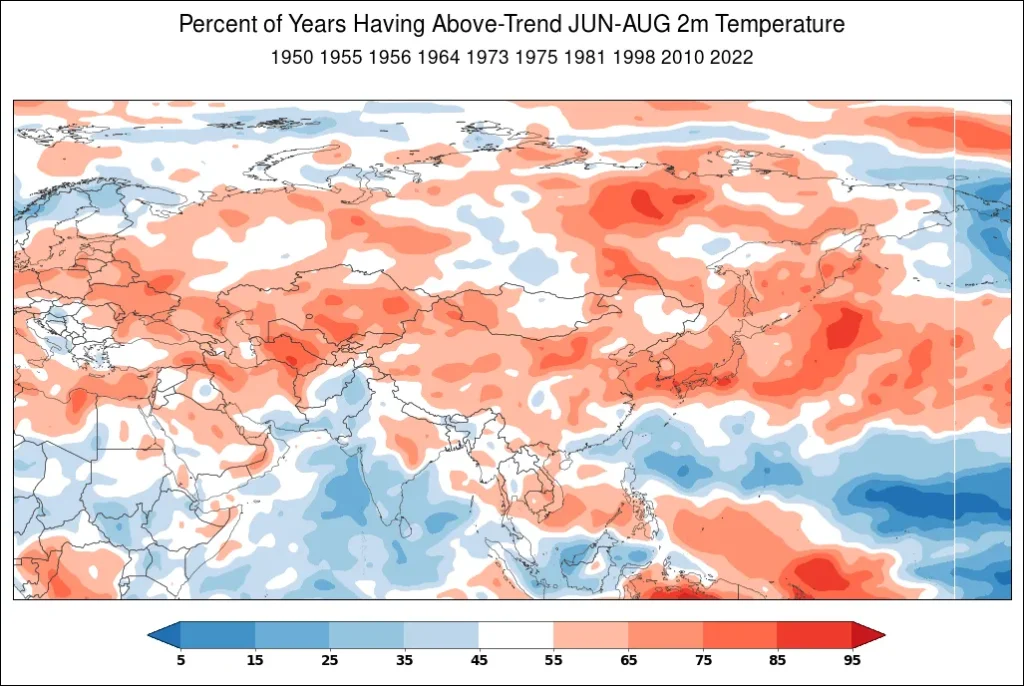
Figure 21. Percent of years having above-trend June through August 2-meter temperature in Asia during a strongly positive SOI.
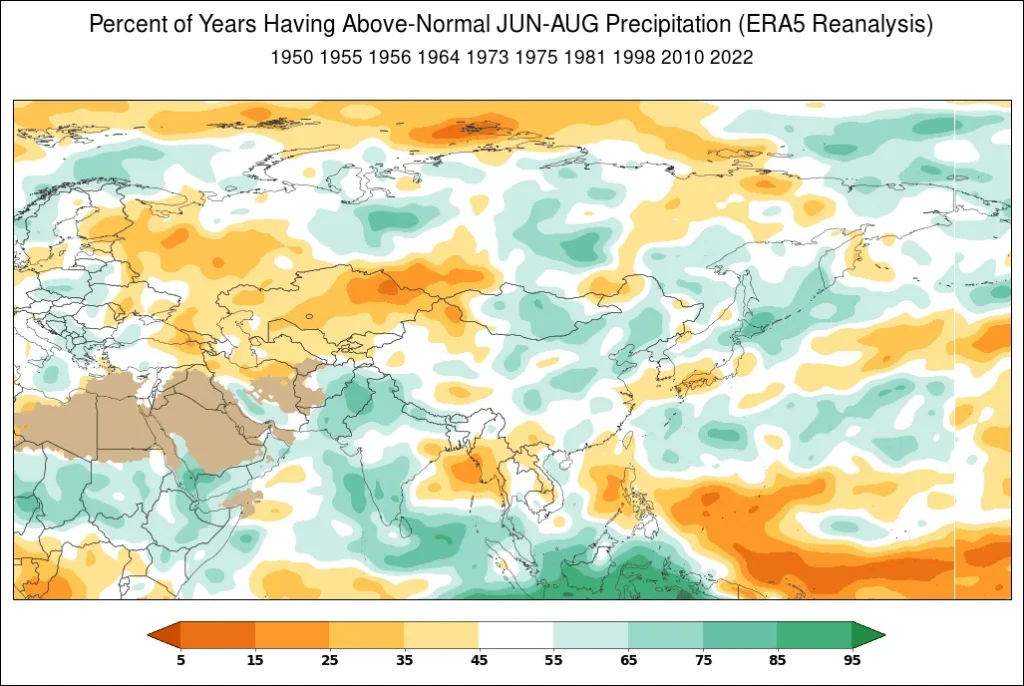
Figure 22. Percent of years having above-trend June through August precipitation in Asia during a strongly positive SOI.
Australia
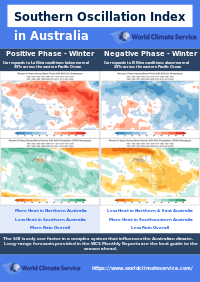
During a strongly positive SOI in Australia from June through August, the northern section of the country shows an increased likelihood of observing above-normal 2-meter temperatures (Figure 23). To add on, there are very low probabilities in southern and southwest Australia of receiving above-normal June through August 2-meter temperatures.
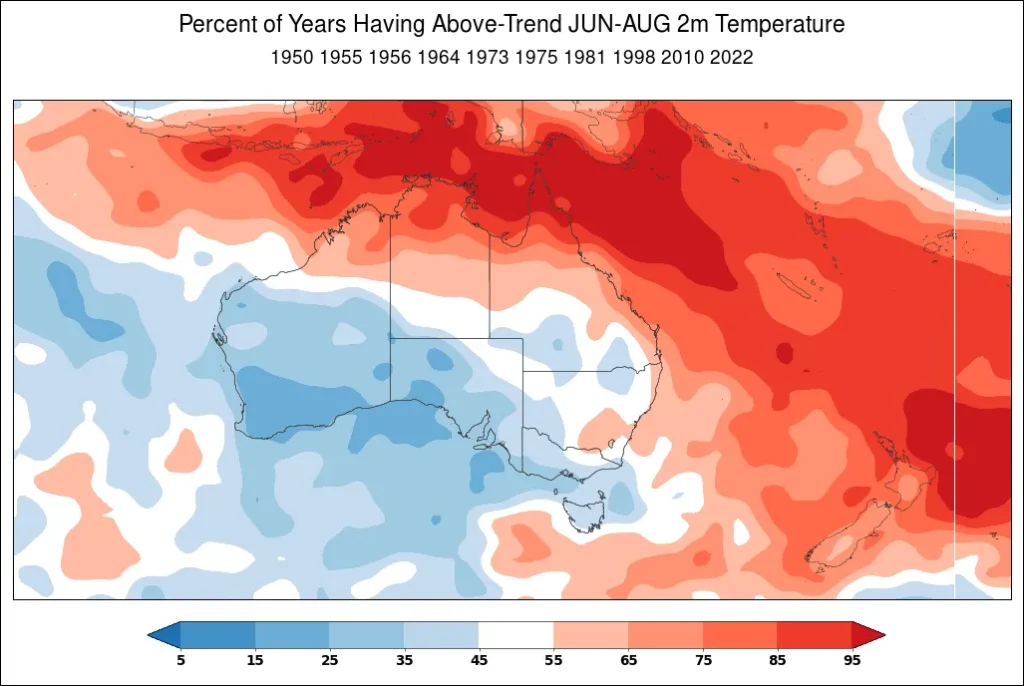
Figure 23. Percent of years having above-trend June through August 2-meter temperature in Australia during a strongly positive SOI.
As seen in Figure 24, the majority of Australia, especially the northern tier, shows large probabilities of observing above-normal June through August precipitation.
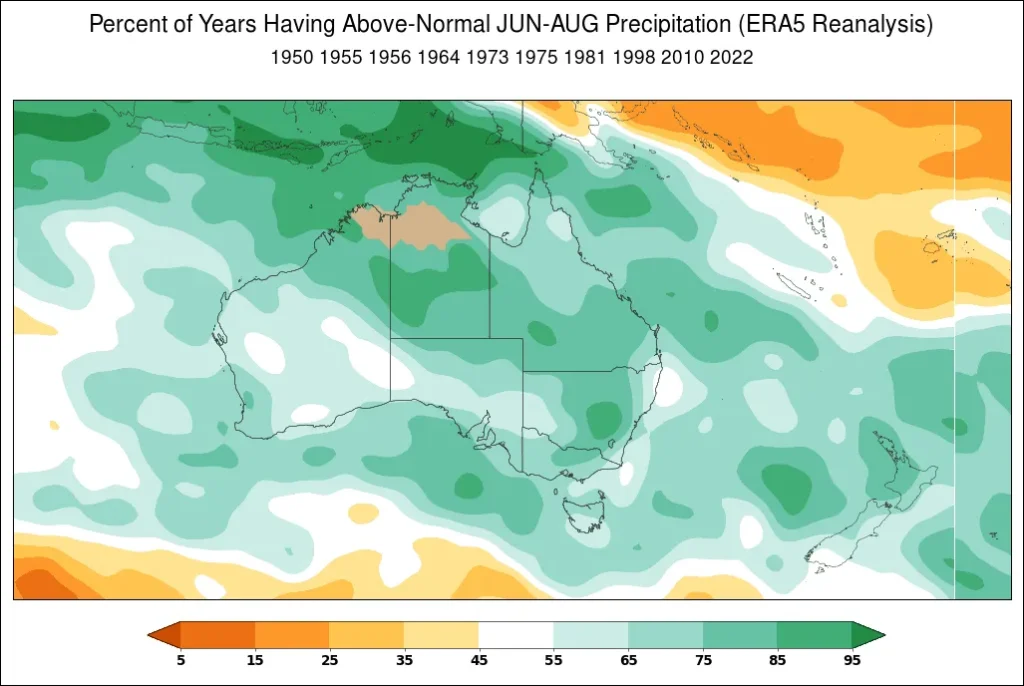
Figure 24. Percent of years having above-trend June through August precipitation in Australia during a strongly positive SOI.
South America
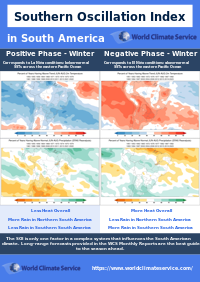
The majority of South America observed very low probabilities of having above-normal June through August 2-meter temperatures during a strongly positive SOI. Although, a small portion of Brazil shows an increased likelihood of receiving above-normal June through August temperatures during a strongly positive SOI. The majority of South America, especially Argentina, shows very low probabilities of receiving above-normal June through August precipitation during a strongly positive SOI. The far northern section of South America does in fact show an increased likelihood of receiving above-normal June through August precipitation during a strongly positive SOI.
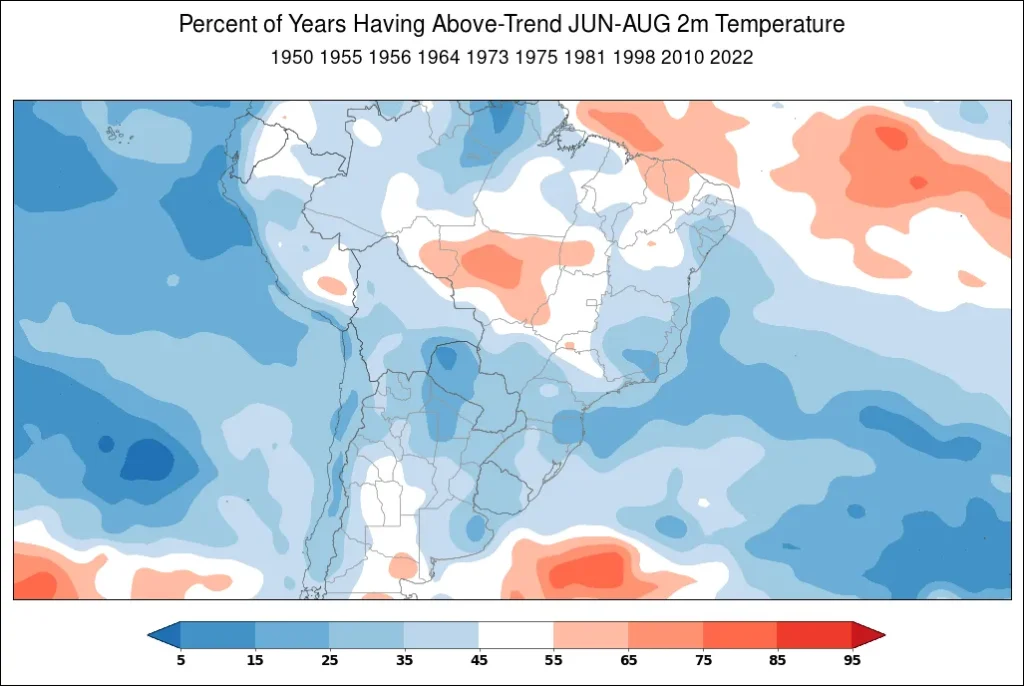
Figure 25. Percent of years having above-trend June through August 2-meter temperature in South America during a strongly positive SOI.
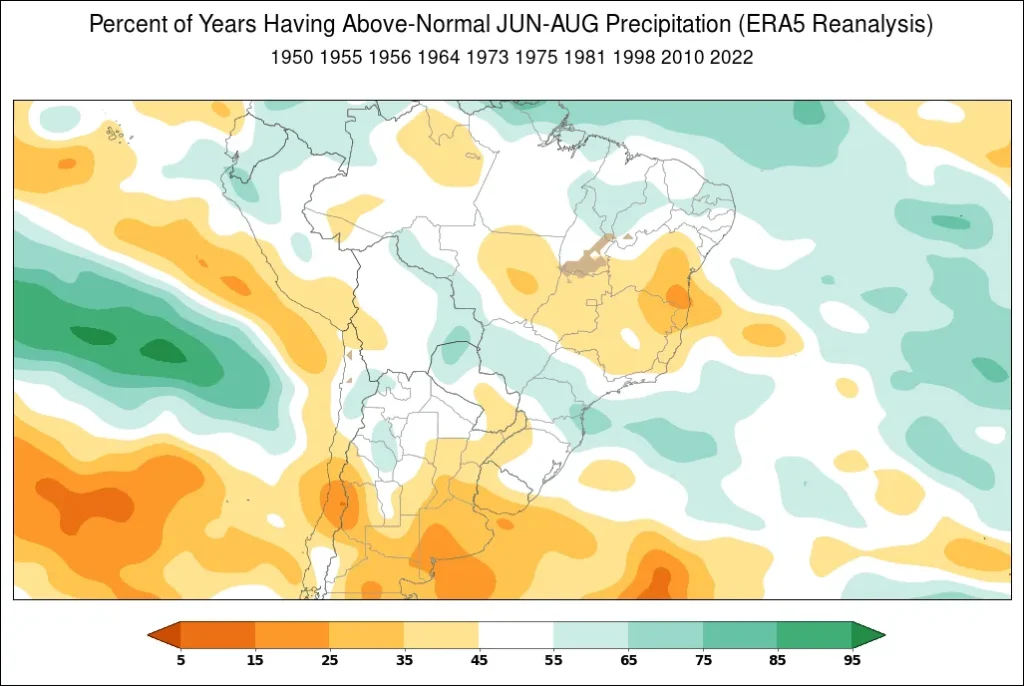
Figure 26. Percent of years having above-trend June through August precipitation in South America during a strongly positive SOI.
Strong negative SOI summer:
During the summer of 2015, there was a strongly negative SOI. As analyzed above, what were the weather conditions such as the SST, t2m2-meter temperature, and precipitation like during that summer? Figure 27 displays the average SST anomaly in degrees Celsius from June through August 2015 using 1991-2020 climatology. Just like Figure 7 and during El Niño, there are warmer than normal SSTs off the coast of South America in the eastern Pacific Ocean.
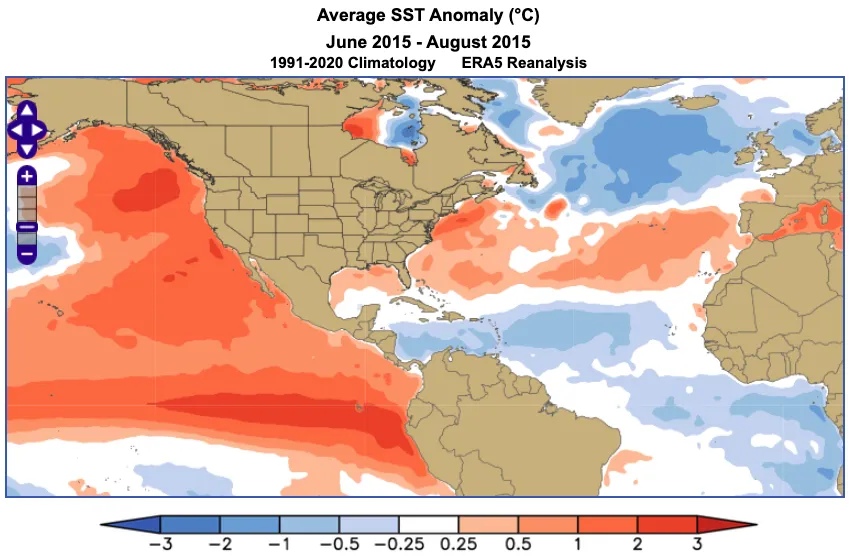
Figure 27. An example of the World Climate Service ERA5 reanalysis mapping product showing the average SST anomaly in °C from June through August 2015, based on the 1991-2020 climatology.
Figure 28 shows the average 2-meter temperature anomaly (°C) in June through August 2015. Similar to Figure 8, there are higher than normal 2-meter temperatures across the pacific northwest and lower than normal 2-meter temperatures across the Great Lakes Region and Midwest.
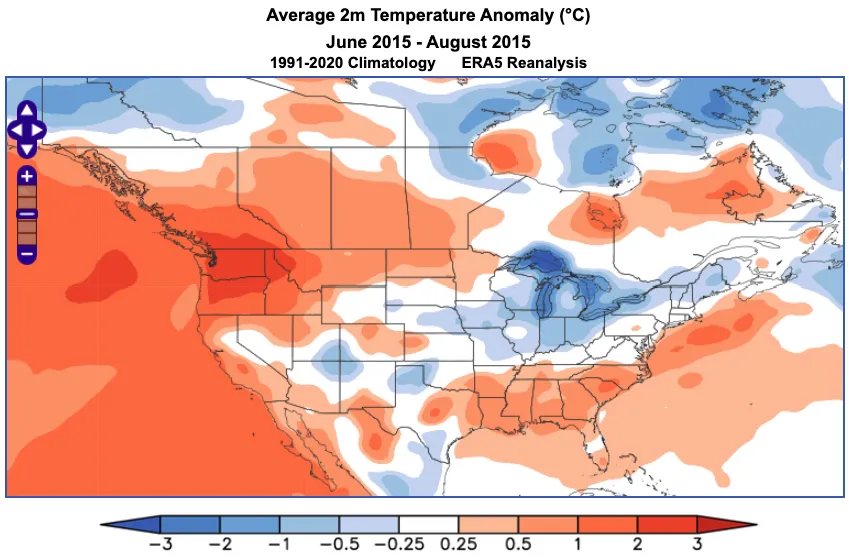
Figure 28. An example of the World Climate Service ERA5 reanalysis mapping product showing the average 2-meter temperature anomaly in °C from June through August 2015, based on the 1991-2020 climatology.
Figure 29, showing the Total precipitation in Percent of Normal from June through August 2015 using 1991-2020 Climatology, has below normal precipitation totals occurring in the pacific northwest and southeast mirroring closely to Figure 9.
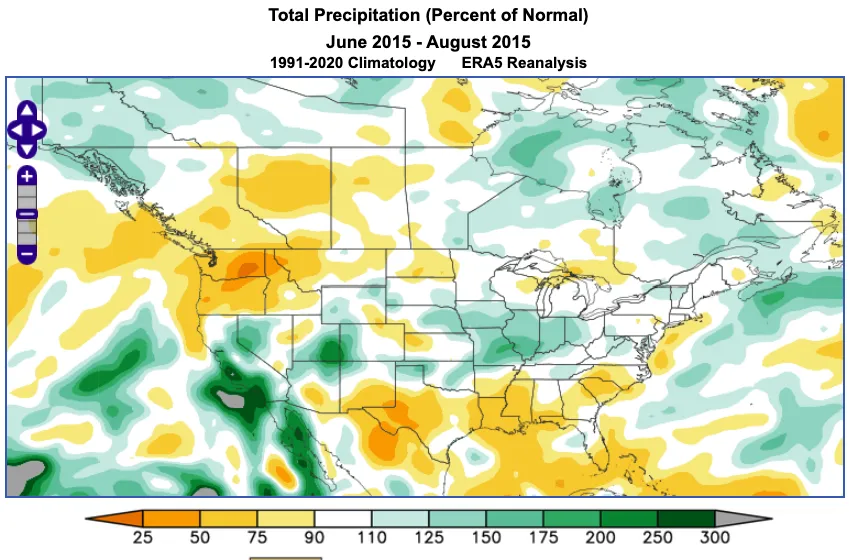
Figure 29. An example of the World Climate Service ERA5 reanalysis mapping product showing total precipitation as a percent of normal from June through August 2015, based on the 1991-2020 climatology.
Europe
Figure 30 and Figure 31 represents Europe 2-meter temperature and precipitation during a strongly negative SOI in June through August. The majority of Europe is shown in Figure 29 to have low likelihoods of observing above-normal 2-meter temperatures during a strongly negative SOI in June through August. Analyzing the precipitation, Figure 31, there is an increased likelihood of countries like Portugal through Germany receiving above-normal precipitation during a strongly negative SOI from June through August. Additionally, the same case could be said of countries such as Ukraine, Moldova, and Belarus.
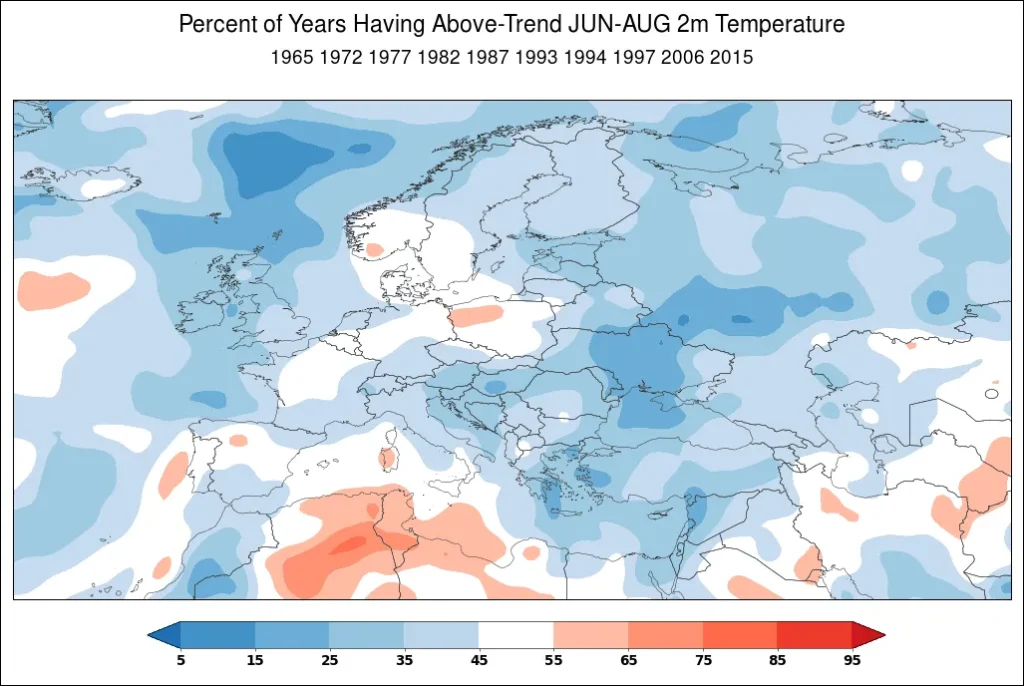
Figure 30. Percent of years having above-trend June through August 2-meter temperature in Europe during a strongly negative SOI.
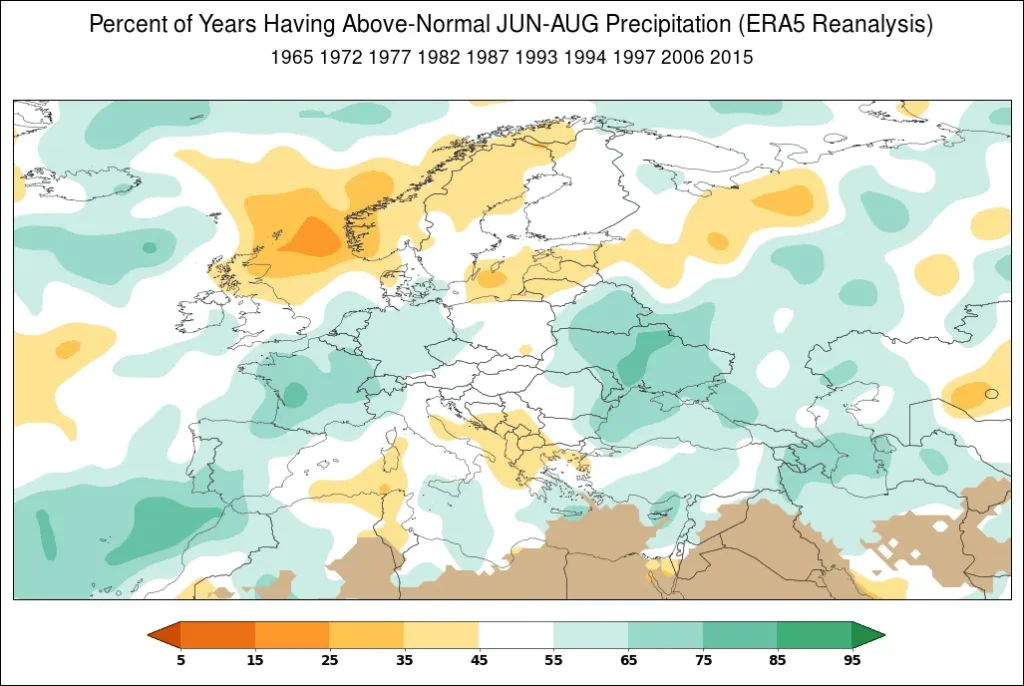
Figure 31. Percent of years having above-normal June through August precipitation in Europe during a strongly negative SOI.
Asia
In Asia during a strongly negative SOI, India and central Russia both show an increased likelihood of observing above-normal June through August 2-meter temperatures during a strongly negative SOI which is shown in Figure 32. To add on about the figure, the majority of China, Japan, and eastern Russia show very low probabilities of observing above-normal 2-meter temperatures. Figure 33 shows the percent of years having above-normal June through August precipitation in Asia during a strongly negative SOI. There are very low probabilities of central China and India receiving above-normal June through August precipitation during a strongly negative SOI.
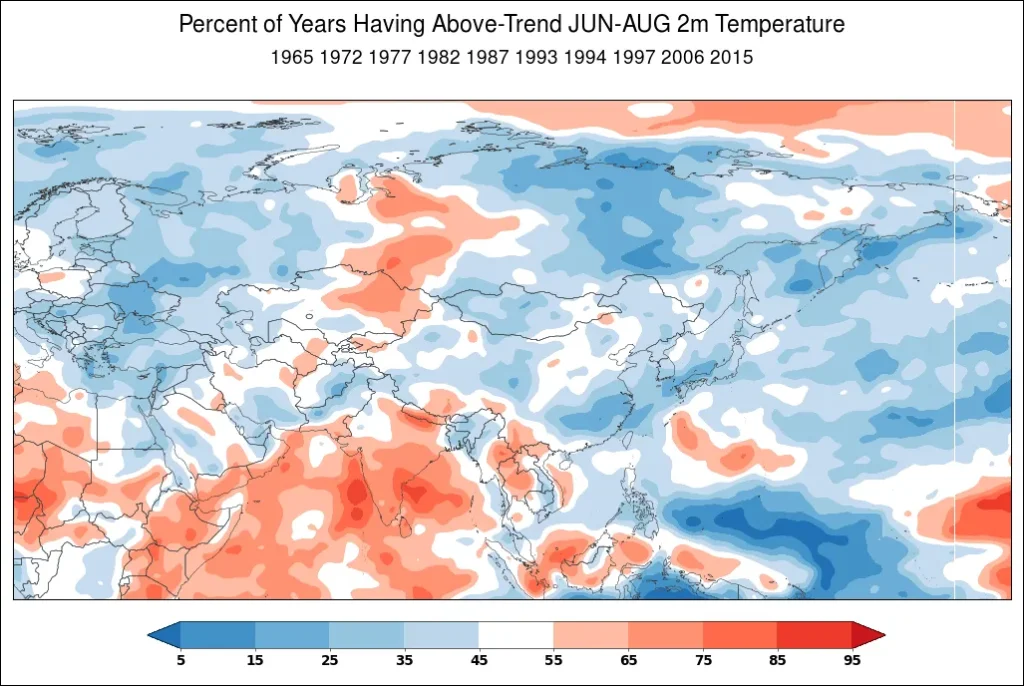
Figure 32. Percent of years having above-trend June through August 2-meter temperature in Asia during a strongly negative SOI.
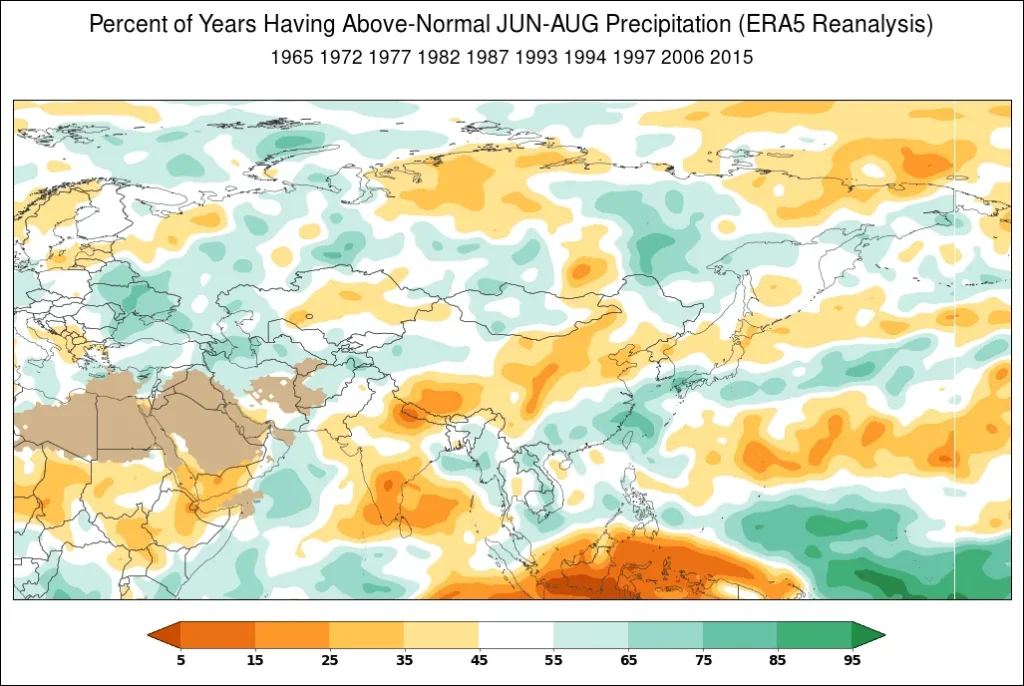
Figure 33. Percent of years having above-trend June through August precipitation in Asia during a strongly negative SOI.
Australia
Figure 34 shows the percent of years having above-trend June through August 2-meter temperature in Australia during a strongly negative SOI. The western portion of Australia shows a high probability of observing above-normal 2-meter temperatures from June through August during a strongly negative SOI. Central and northern Australia shows low likelihoods of observing above-normal 2-meter temperatures. In Figure 35, showing precipitation, the majority of Australia how extremely low probabilities of receiving above-normal June through August precipitation during a strongly negative SOI.
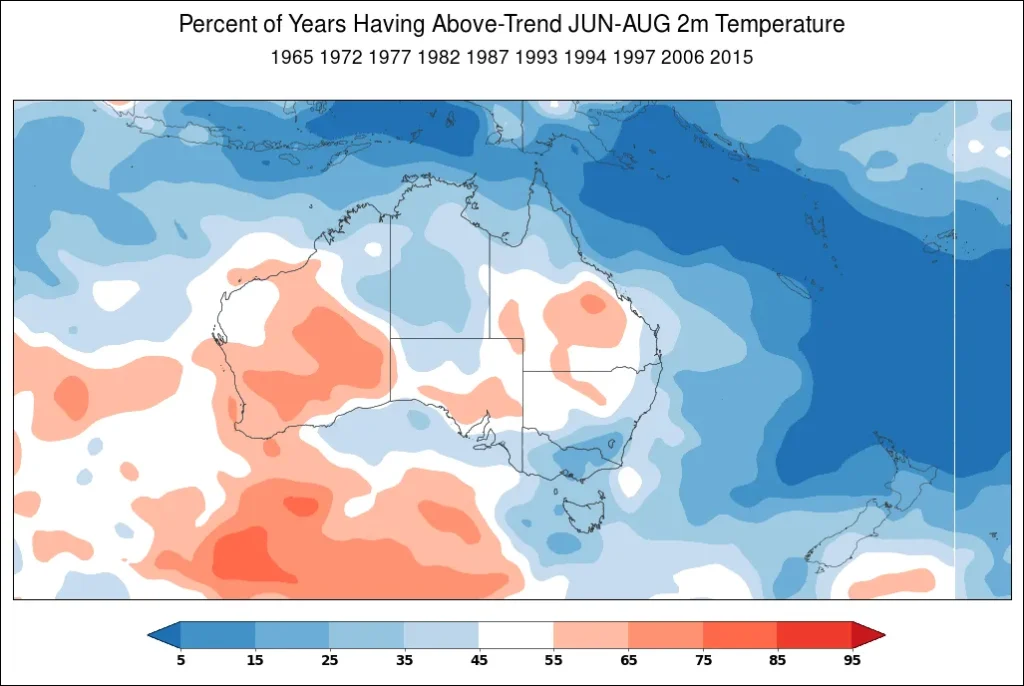
Figure 34. Percent of years having above-trend June through August 2-meter temperature in Australia during a strongly negative SOI.
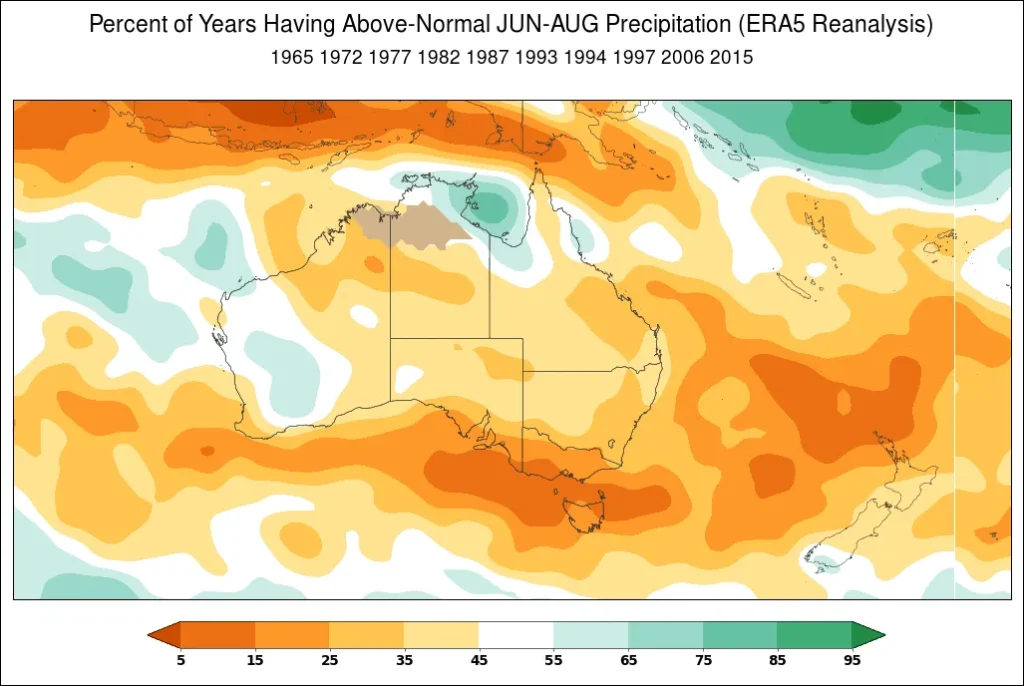
Figure 35. Percent of years having above-trend June through August precipitation in Australia during a strongly negative SOI.
South America
In South America the western, central, and southern parts of the continent show an increased likelihood of receiving above-normal June through August 2-meter temperatures during a strongly negative SOI (Figure 36). Additionally, the majority of South America also show high probabilities of receiving above-normal June through August precipitation during a strongly negative SOI (Figure 37).
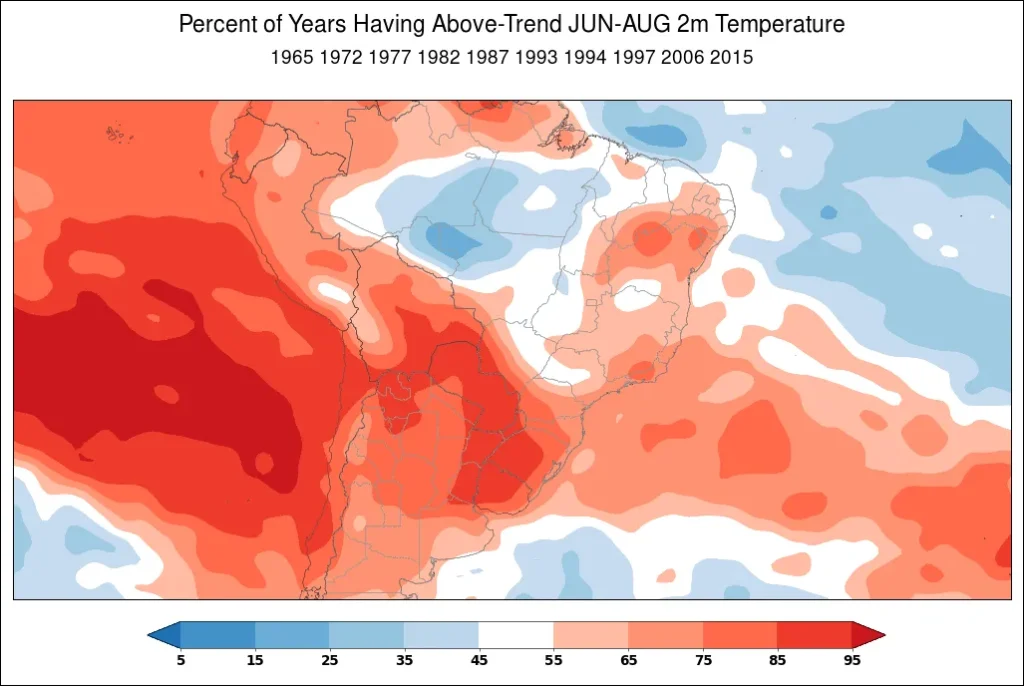
Figure 36. Percent of years having above-trend June through August 2-meter temperature in South America during a strongly negative SOI.
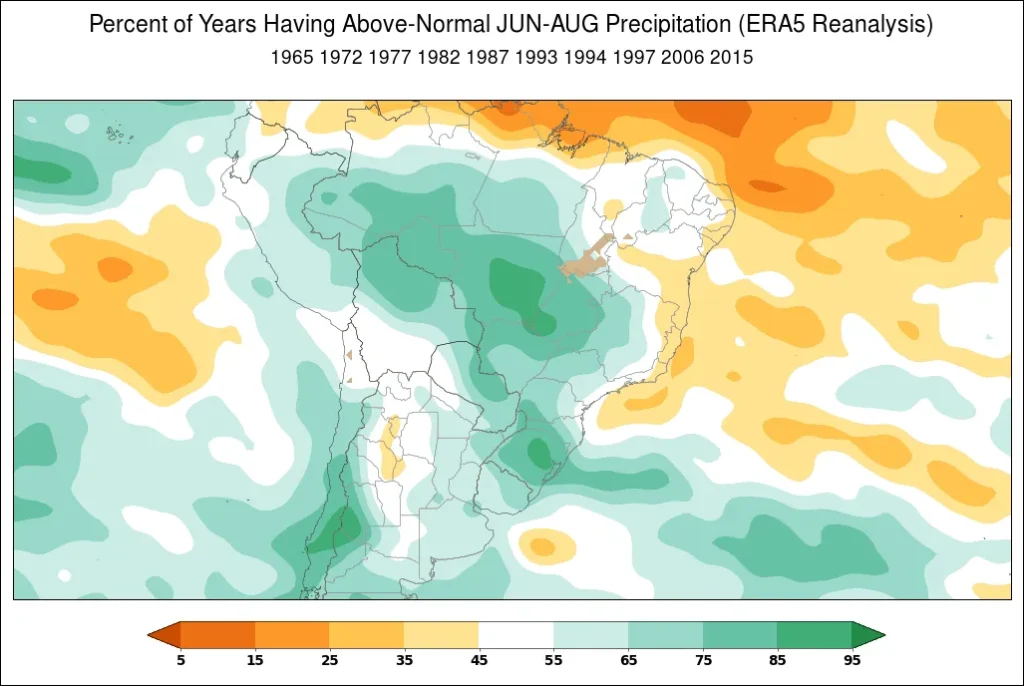
Figure 37. Percent of years having above-trend June through August precipitation in South America during a strongly negative SOI.
These case studies demonstrate how the SOI, coupled with World Climate Service tools, offers reliable insights into seasonal weather patterns.
Forecasting Applications of SOI
The Southern Oscillation Index (SOI) is a powerful tool for predicting seasonal weather patterns. By analyzing the atmospheric pressure differences between Darwin, Australia, and Tahiti, the SOI provides insight into the phases of El Niño and La Niña, which significantly influence global precipitation, temperature, and storm activity. Understanding SOI-driven climate variability is essential for effective planning for businesses and industries that rely on accurate weather forecasting, such as agriculture, energy, and commodities.
Leveraging SOI with World Climate Service
While the SOI is invaluable, it is not without limitations. Seasonal forecasting based solely on the SOI can be challenging due to its dependence on other atmospheric and oceanic variables. Isolating its influence in complex climate systems often requires advanced analysis tools. This is where the World Climate Service adds value. Our platform integrates the SOI with various other climate indices, such as the North Atlantic Oscillation (NAO) and the Pacific Decadal Oscillation (PDO), to comprehensively understand seasonal climate variability.
By combining the SOI with additional indices, our advanced forecasting methods improve accuracy and reliability. The World Climate Service employs techniques such as:
Analog Forecasting: Using historical patterns of the SOI and other indices to predict future weather conditions.
Statistical Models: Sophisticated algorithms that leverage SOI data alongside other climatic inputs to identify trends and correlations.
Accessing Reliable SOI-Based Forecasts
The World Climate Service offers an intuitive platform to access the latest SOI data and forecasts. Whether you need long-term seasonal outlooks or subseasonal updates, our tools are designed to deliver actionable insights tailored to your needs. By integrating SOI data into comprehensive forecasting frameworks, our platform empowers clients to anticipate and adapt to climate variability effectively. In the discussion above, we established a link between La Niña, the Southern Oscillation Index (SOI), and Niño3.4. Figure 21 demonstrates how seasonal forecasts, available through the World Climate Service, provide valuable insights into Niño3.4 trends. This particular graphic features the Copernicus Index Seasonal Forecasts for Niño3.4, initialized on December 1, 2024. It showcases forecasts from multiple models alongside the multi-model mean, offering a comprehensive view of projected outcomes.
Figure 21. Illustrates the World Climate Service Copernicus Index seasonal forecasts for Niño3.4, initialized on December 1, 2024, comparing individual model predictions with the multi-model mean.
Explore the World Climate Service today to gain access to industry-leading climate tools that transform weather data into actionable intelligence. Contact us to learn more about how our products can enhance your decision-making and reduce risks tied to seasonal climate changes.
Conclusion
The Southern Oscillation Index is more than just a measure of atmospheric pressure differences—it is a gateway to understanding and navigating climate variability. By leveraging the SOI alongside related indices, the World Climate Service empowers businesses to make informed decisions, mitigate risks, and seize opportunities in an ever-changing climate landscape.
Explore the World Climate Service to access cutting-edge forecasting tools and gain a competitive edge in managing climate risks. Subscribe to our updates and let us help you transform weather challenges into actionable opportunities.
Works Cited
Braun, Karen. “Argentina’s Soy, Corn May Hinge on La Nina’s Exit after Dry 2022.” The Star, 4 Jan. 2023, www.thestar.com.my/business/business-news/2023/01/05/argentinas-soy-corn-may-hinge-on-la-ninas-exit-after-dry-2022.
Chiummiento, Juan. “La Niña Ends, but Drought Exposes Deeper Problems for Argentina.” Dialogue Earth, 6 June 2023, dialogue.earth/en/climate/370215-la-nina-ends-but-drought-exposes-deeper-problems-for-argentina/.