Tropical North Atlantic (TNA) Index: Immediate Impacts
Sea surface temperatures in the tropical North Atlantic Ocean likely substantially influence recent precipitation in Brazil and Argentina. Over the previous 60 days (as of September 7, 2024), vast portions of Brazil (BR) and Argentina (AR) have been extremely dry. If conditions don’t improve soon, the South American crop planting season will be significantly impacted.
Figure 1 shows the CropProphet (CP) observed percent of normal precipitation since July 10, 2024. The BR first-season corn production weighted precipitation has been 53% of normal over the last 60 days, and other crop-growing regions have received similarly low precipitation amounts. The AR corn production weighted precipitation was lower over the prior 60 days, at 49% of normal.
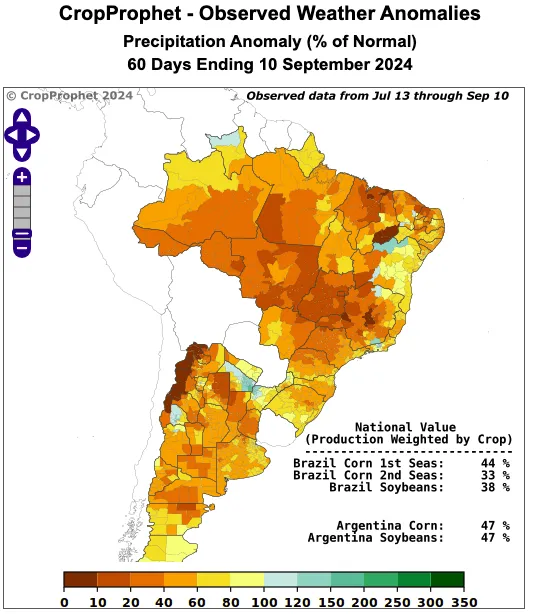
Figure 1. Brazil and Argentina Observed 60-day Crop Production Weighted Precipitation Graphic.
Why was Brazil’s and Argentina’s precipitation so low during the middle months of 2024? Understanding possible reasons for climate variability is an important aspect of long-range forecasting.
A new sea-surface temperature-based climate index was recently added to the World Climate Service. The index is called the Tropical North Atlantic index and is described in greater detail below. However, the TNA index has been positive for many months, which can be analyzed using the Climate Index Data Tool on WCS (Figure 2).
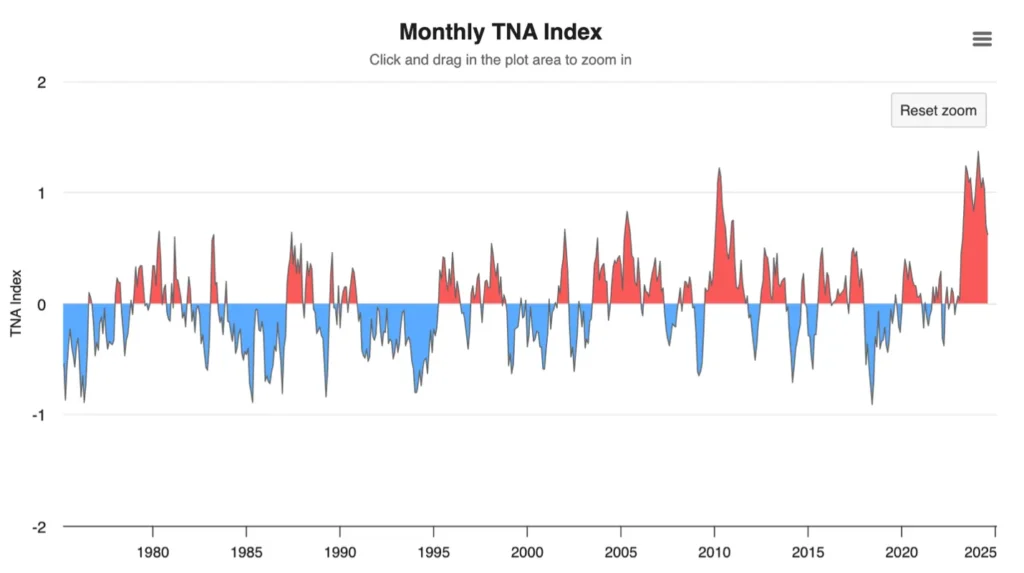
Figure 2. The WCS Climate Index Data Tool, part of the WCS Climate Analysis Tools, displays the monthly TNA Index values over time.
We use the World Climate Service seasonal index analog analysis tool to inspect the impact of a positive TNA index on South American precipitation. A positive TNA index for June, July, and August indicates a substantially low likelihood of above-normal rainfall for BR and AR. In other words, a positive TNA index during June, July, and August is associated with below-normal precipitation in BR and AR. This signal aligns with the 60-day observed precipitation from CropProphet. The World Climate Service-based analysis suggests that the positive TNA index has substantially influenced the current dry period in BR and AR.
World Climate Service customers use tools such as climate index analogs to assess the impact of various climate indices on specific regions globally.
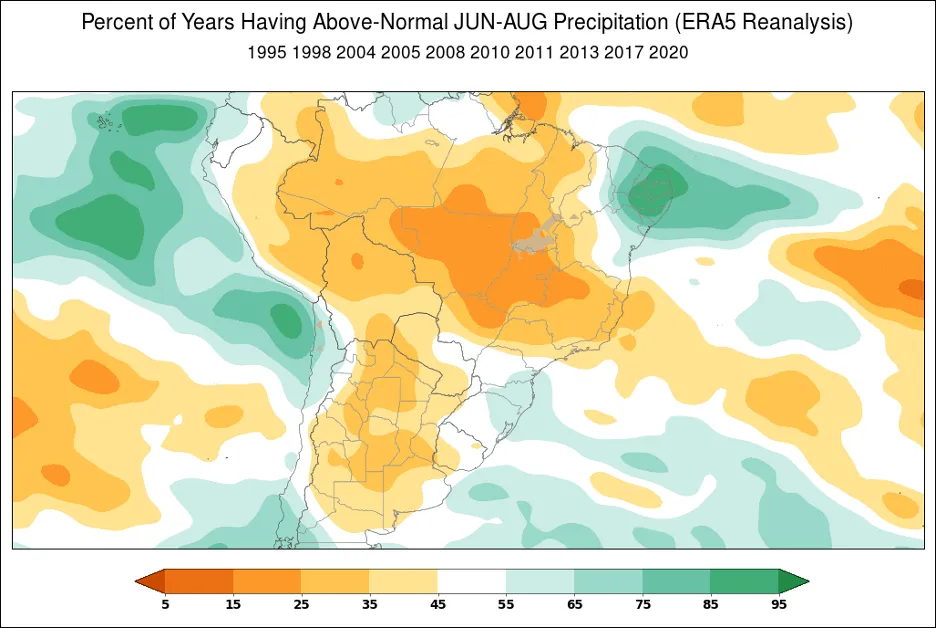
Figure 3. WCS Seasonal Climate Index Analogs Tool illustrating the impact of a negative TNA Index on precipitation in South America from June through August.
This article analyzes the Tropical North Atlantic (TNA) Index: what it is, how it impacts the weather, and how we use it in long-range weather forecasting.

What is the Tropical North Atlantic (TNA) Index?
The Tropical North Atlantic index is a climate index tracking sea-surface temperature (SST) anomalies in the eastern tropical North Atlantic Ocean, typically spanning the area from 55°W to 15°W and 5°N to 25°N (Figure 4). It serves as a crucial indicator in climate science, helping to identify SST variations that influence atmospheric circulation, precipitation patterns, and the development of tropical systems.
The TNA Index influences various regions, including the Caribbean, southeastern United States, northern South America, western Africa, Central America, and the eastern United States, impacting temperature and precipitation variability.
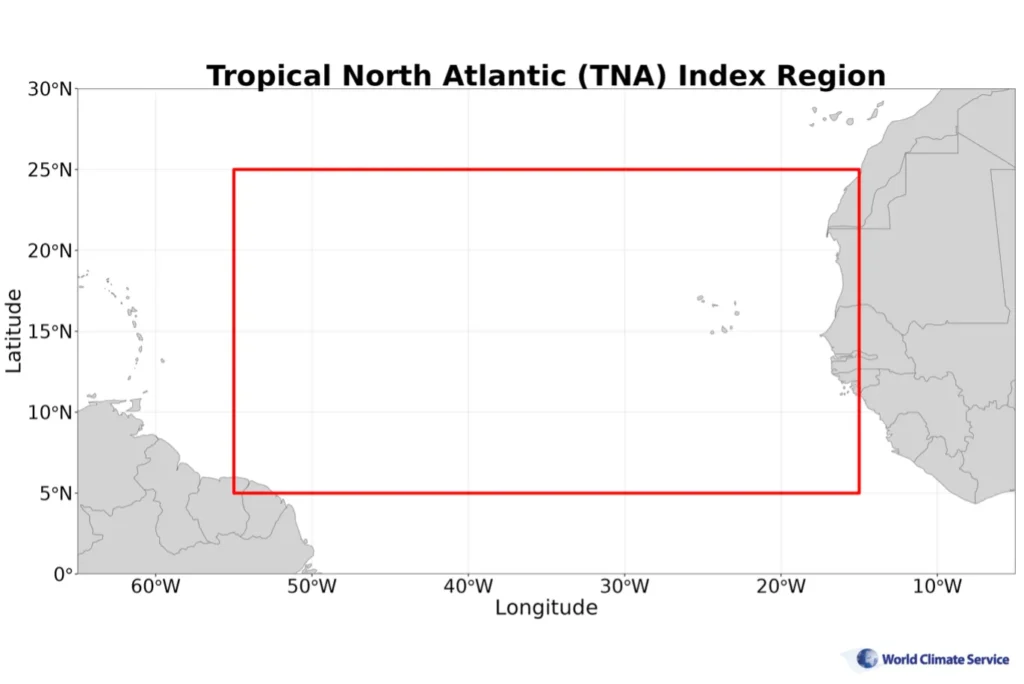
Figure 4. The TNA Index location is boxed in with the Longitude and Latitude (55°W to 15°W and 5°N to 25°N).
The TNA Index was established in a study by Enfield et al. (JGR, 1999), which discovered dipolar patterns across the tropical Atlantic with periodicities of 8-12 years during boreal winter-spring and 2.3 years during boreal summer-fall. The index measures SST anomalies relative to a monthly climatological seasonal cycle based on 1991-2020. The calculation involves a detailed and robust process: first, SST anomalies are computed in relation to the monthly climatology; then, linear interpolation is applied to derive weekly anomalies from the monthly data; finally, the spatial averaging of the gridded SST analysis is weighted by surface area to represent the region accurately.
Tropical North Atlantic Index: Positive Phase
A positive TNA Index is observed when sea surface temperature (SST) anomalies in the Tropical North Atlantic are above normal. This positive phase has several important implications, including heightened tropical weather activity, increased precipitation in the Caribbean and Gulf of Mexico, changes in atmospheric circulation, and effects on other teleconnections, notably the El Niño-Southern Oscillation (ENSO).
Figure 5 shows the percentage of years with probabilities of above-normal SSTs. There is a significant likelihood of above-normal SSTs across much of the Atlantic Ocean, particularly in the region corresponding to the TNA Index.
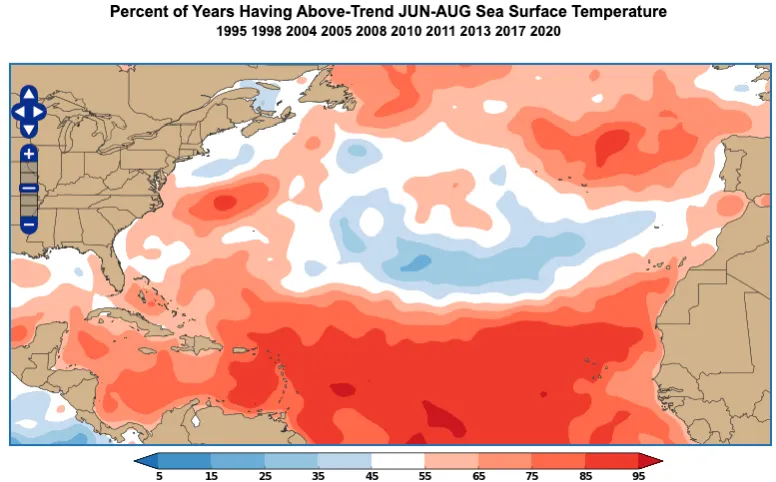
Figure 5. WCS Seasonal Climate Index Analogs Tool highlighting the impact of positive TNA Index on SSTs in the Atlantic Ocean from June through August.
Focusing on North America, the WCS Seasonal Climate Index Analog tool indicates that a positive TNA Index is associated with a high likelihood of above-normal precipitation in the eastern United States. In contrast, the probability of above-normal rainfall is lower in the Mountain West region from June through August (Figure 6).
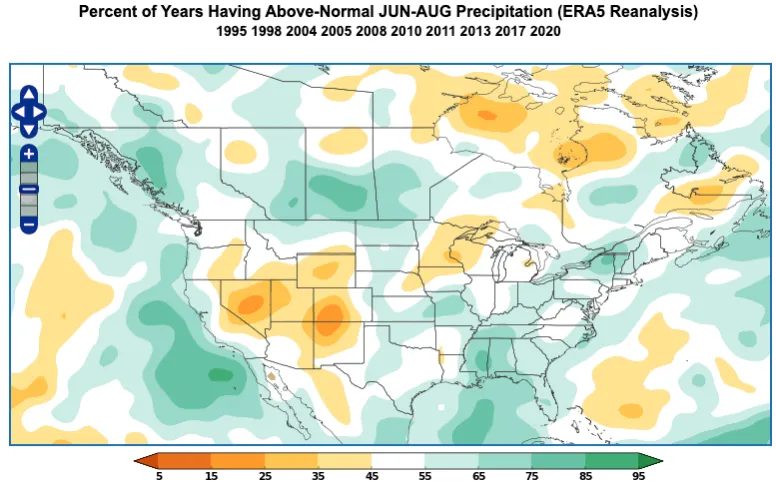
Figure 6. WCS Seasonal Climate Index Analogs Tool illustrating the impact of a positive TNA Index on precipitation in North America from June through August.
Next, an analysis of the summertime US temperature impact of the TNA index (Figure 7) reveals a low likelihood of above-normal temperatures across much of the western US from June through August. Conversely, there is a high likelihood of above-normal temperatures in the southern and eastern regions of the US during the same period.
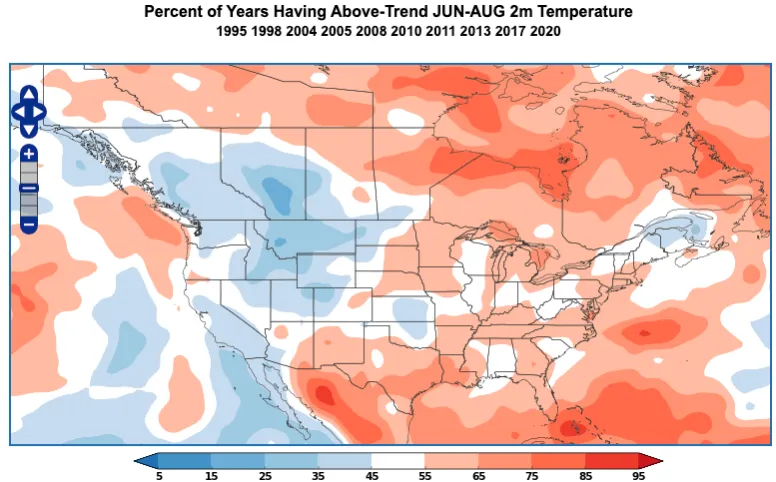
Figure 7. WCS Seasonal Climate Index Analogs Tool showing the impact of a positive TNA Index on temperatures in North America from June through August.
Tropical North Atlantic Index: Negative Phase
A negative TNA Index occurs when sea surface temperature (SST) anomalies in the Tropical North Atlantic are below normal. Unlike a positive TNA Index, associated with increased tropical activity, a negative TNA Index is linked to a lower likelihood of tropical development. This is because cooler SSTs provide less energy and moisture, weakening the convection process essential for tropical storms. Consequently, there is typically reduced precipitation in the Caribbean and the Gulf of Mexico. Furthermore, a negative TNA Index significantly affects rainfall patterns in South America and western Africa. In summary, decreased tropical activity due to a negative TNA Index leads to lower precipitation totals in these key regions.
A negative TNA Index is associated with very low probabilities of above-normal SSTs within the TNA Index region, as illustrated in Figure 8. The likelihood of above-normal SSTs remains very low for June through August, when the TNA Index is negative.
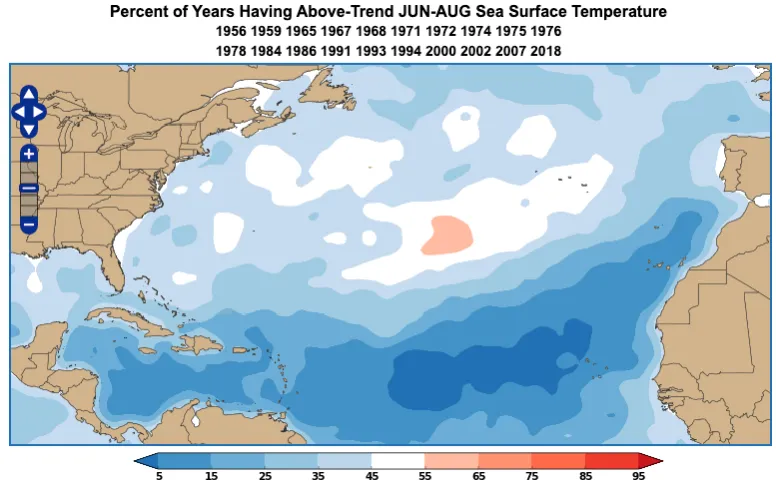
Figure 8. WCS Seasonal Climate Index Analogs Tool showing the impact of a negative TNA Index of SSTs across the Atlantic Ocean from June through August.
In Europe, during a negative TNA phase from June through August, central and northern regions are highly likely to experience above-normal precipitation (see Figure 9). Conversely, southern Europe and Ukraine have a very low probability of above-normal precipitation during this period.
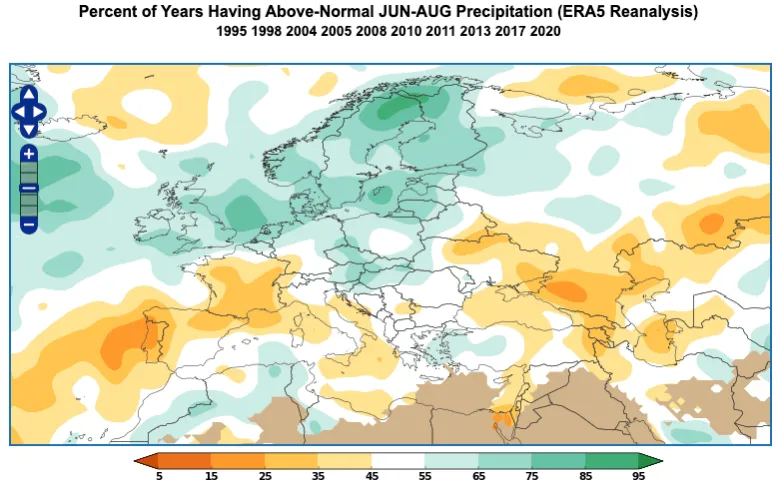
Figure 9. WCS Seasonal Climate Index Analogs Tool illustrating the impact of a negative TNA Index on precipitation in Europe from June through August.
Figure 10 illustrates the effects of a negative TNA phase on temperatures in Europe from June through August. During this period, eastern Europe and far western Europe are more likely to experience above-normal temperatures. Conversely, central Europe has a low probability of experiencing above-normal temperatures.
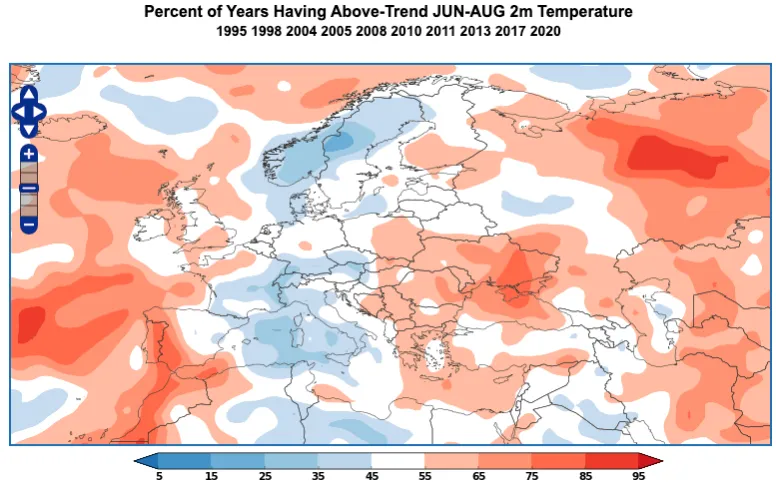
Figure 10. WCS Seasonal Climate Index Analogs Tool showing the impact of a negative TNA Index on temperatures in Europe from June through August.
Tropical North Atlantic Index: Importance to Long-Range Forecasting
The TNA index is critical in long-range forecasting due to its role in predicting climate variability in regions surrounding the Atlantic Ocean and its influence on other teleconnections (specifically, ENSO). By affecting sea surface temperature anomalies, the TNA helps forecasters anticipate shifts in precipitation, temperature patterns, and storm activity, making it a valuable tool for understanding and predicting broader climate dynamics.
The teleconnection between ENSO and the TNA Index is one of the most robust ENSO teleconnections (Lopez-Parages & Terray, 2021). The TNA, for instance, can affect the strength and duration of ENSO events. During the summer, the TNA’s influence can amplify ENSO’s impact on the North Atlantic region. Both phases of ENSO—El Niño and La Niña—can also impact the TNA index. During El Niño, tropical activity in the tropical Atlantic is reduced due to lower SSTs in the Atlantic basin. Conversely, during La Niña events, higher SSTs in the tropical North Atlantic contribute to increased tropical activity.
Tropical North Atlantic Index: Conclusion
The Tropical North Atlantic (TNA) Index tracks sea surface temperature (SST) anomalies in the eastern North Atlantic Ocean, covering the area from 55°W to 15°W and 5°N to 25°N (Figure 4). This index is valuable for understanding its impact on tropical activity in the Atlantic Ocean and temperatures and precipitation in nearby regions, including western Africa, the Caribbean, northeastern South America, and southeastern North America. Clients are encouraged to use the Seasonal Index Analogs tool to assess how TNA’s positive, neutral, or negative phases influence each region.
Tropical North Atlantic Index: Works Cited
Casselman, J. W., Lübbecke, J. F., Bayr, T., Huo, W., Wahl, S., & Domeisen, D. I. (2023). The teleconnection of extreme El Niño–Southern Oscillation (ENSO) events to the tropical North Atlantic in coupled climate models. Weather and Climate Dynamics, 4(2), 471-487.
Enfield, D. B., Mestas‐Nuñez, A. M., Mayer, D. A., & Cid‐Serrano, L. (1999). How ubiquitous is the dipole relationship in tropical Atlantic sea surface temperatures? Journal of Geophysical Research: Oceans, 104(C4), 7841-7848.
Jiang, L., & Li, T. (2021). Impacts of tropical North Atlantic and equatorial Atlantic SST anomalies on ENSO. Journal of Climate, 34(14), 5635-5655.
López-Parages, J., & Terray, L. (2022). Tropical North Atlantic response to ENSO: sensitivity to model spatial resolution. Journal of Climate, 35(1), 3-16.
Tropical Northern Atlantic Index (TNA). OOPC | State of the Ocean climate | Surface indices | Atlantic | TNA. (n.d.). https://stateoftheocean.osmc.noaa.gov/sur/atl/tna.php#:~:text=Tropical%20Northern%20Atlantic%20Index%20(TNA,eastern%20tropical%20North%20Atlantic%20Ocean.