The Indian Ocean Dipole, or IOD, is a climate phenomenon in the Indian Ocean defined by the difference in sea surface temperatures between the eastern and western parts of the basin. Because that east-west temperature contrast changes rainfall, convection, and atmospheric circulation, the IOD can significantly affect climate and weather across Australia, Southeast Asia, East Africa, and even parts of the mid-latitudes. That is why the Indian Ocean Dipole (IOD) climate index is closely watched by long-range forecasters on subseasonal and seasonal timescales.
Below, we explain what the Indian Ocean Dipole is, how the IOD index works, what positive and negative phases mean, how to interpret the current status and forecast, and why the IOD matters for weather-sensitive risk.
Quick Answer
What is the Indian Ocean Dipole?
The Indian Ocean Dipole is the east-west difference in tropical Indian Ocean sea surface temperatures.
What is the IOD index?
The IOD is usually tracked with the Dipole Mode Index, or DMI, which measures the sea surface temperature gradient between the western equatorial Indian Ocean and the southeastern equatorial Indian Ocean.
What happens in a positive IOD?
A positive IOD usually means warmer-than-normal waters in the western Indian Ocean, cooler-than-normal waters near Indonesia, drier conditions across parts of Australia and Indonesia, and wetter conditions in East Africa.
What happens in a negative IOD?
A negative IOD usually means cooler-than-normal waters in the western Indian Ocean, warmer-than-normal waters near Indonesia, wetter conditions across parts of Australia and Indonesia, and drier conditions in East Africa.
Why does the IOD matter for Energy Meteorologists?
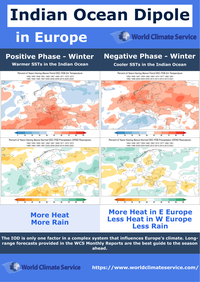
The Indian Ocean Dipole is especially important for energy meteorologists in Australia and Asia because it influences seasonal rainfall, temperatures, and drought conditions across those regions. Its effects also extend beyond the tropics into parts of the mid-latitudes, including Europe.
Because the IOD can remain in one phase for an extended period and is often predictable well in advance, it provides useful seasonal forecast context for weather-sensitive risk. It is usually most valuable when assessed alongside other large-scale climate drivers rather than in isolation.
Indian Ocean Dipole Quick Summary PDFs
Check out and click on the Indian Ocean Dipole (IOD) quick-summary PDFs for:
United States
Australia
Europe
How Does the Indian Ocean Dipole Impact Climate?
The Indian Ocean Dipole can be thought of as the Indian Ocean branch of the Walker circulation. In practical terms, it reflects the anomalous sea surface temperature gradient between the western equatorial Indian Ocean and the southeastern equatorial Indian Ocean.
When ocean temperatures shift between the western and eastern Indian Ocean, convection changes with them. Those changes alter the Walker circulation and, in turn, affect rainfall and atmospheric circulation across the tropical Indian Ocean and nearby land areas.
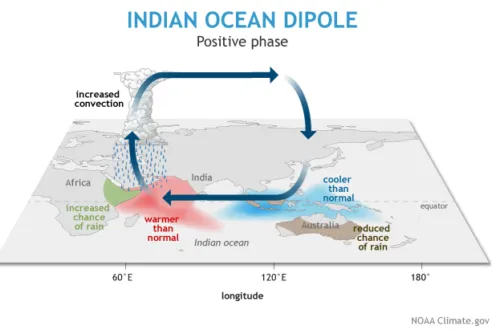
Figure 1. The positive and negative phase of the Indian Ocean dipole sea surface temperature pattern.
The Indian Ocean Dipole often moves in sympathy with the El Niño-Southern Oscillation (ENSO) and the Southern Oscillation Index (SOI), but not always. Some IOD events can become important climate drivers even when ENSO is neutral. The strong positive IOD event of 2019 is a good example. Another important difference is timing: ENSO usually peaks in Northern Hemisphere winter, while the IOD can peak at a different point in the annual cycle.
The impacts of the IOD are felt not only in the tropics, but also in weather patterns across parts of the mid-latitudes. Like El Niño and La Niña, the Indian Ocean Dipole changes where rising and sinking air is favored across the tropics, and those changes affect regional and large-scale climate outcomes.
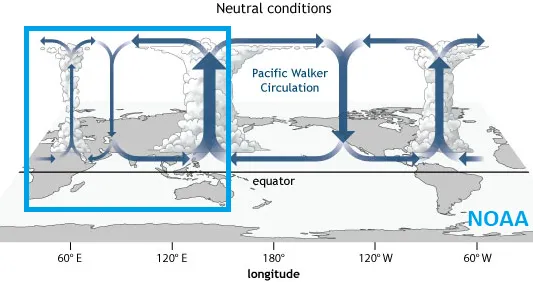
Figure 2. Pacific Walker Circulation during neutral conditions.
What is the Indian Ocean Dipole Index (DMI)?
The Indian Ocean Dipole index is most commonly measured with the Dipole Mode Index. This index tracks the east-west contrast in Indian Ocean sea surface temperatures rather than the temperature anomaly in one location alone.
A positive DMI means the western equatorial Indian Ocean is warmer relative to the eastern side. A negative DMI means the eastern side is warmer relative to the western side. Because this gradient influences convection and circulation, the DMI provides a practical way to monitor whether the IOD is positive, negative, or neutral.
For forecasters, the value of the DMI is that it offers a compact, trackable signal for a climate driver that can persist for weeks to months and affect seasonal rainfall risk.
Indian Ocean Dipole: Current Status
The current status of the Indian Ocean Dipole is shown in the chart below.
The IOD often remains in one phase for several weeks to many months. That persistence is one reason the Indian Ocean Dipole is a seasonal climate index rather than a short-lived subseasonal pattern such as the PNA. Because the IOD is generally well predicted by dynamical models, forecasters can often be reasonably confident about which phase will be favored over the coming months.
Figure 3. Daily IOD index (auto-updates at 12:00 PM ET).
When reading the current status, focus on three questions:
1. Is the IOD currently positive, negative, or near neutral?
2. Is the signal strengthening or fading?
3. Is the current signal consistent with the model forecast over the next several weeks and months?
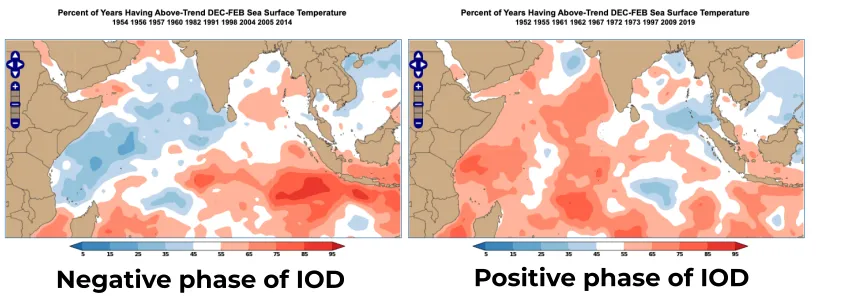
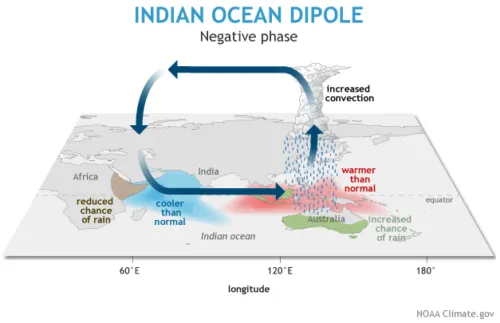
What is the Negative Phase of the IOD?
The negative phase of the IOD is associated with cooler-than-normal sea surface temperatures in the western Indian Ocean and warmer-than-normal sea surface temperatures near Indonesia. This setup strengthens the usual circulation across the basin.
Stronger circulation tends to support more persistent westerly winds over the ocean, more vigorous convection over Indonesia, and greater odds of drought across the Horn of Africa. In broad terms, this pattern is consistent with La Niña-like behavior in the tropical climate system.
Figure 5. The negative phase of the IOD boosts the usual circulation over the Indian Ocean
The World Climate Service system allows users to explore the impacts of the Indian Ocean Dipole and other climate indices by phase and month of year. The same system can be used to produce maps like the ones shown in this article for major weather variables around the world.
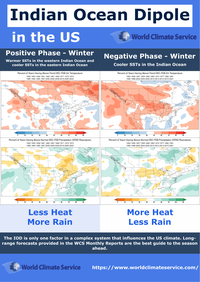
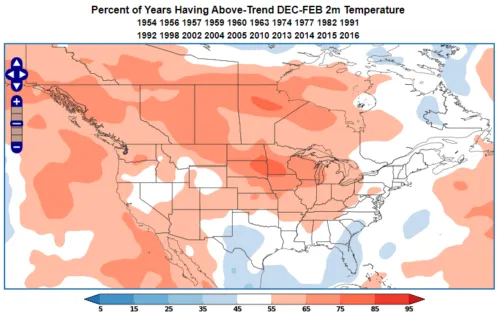
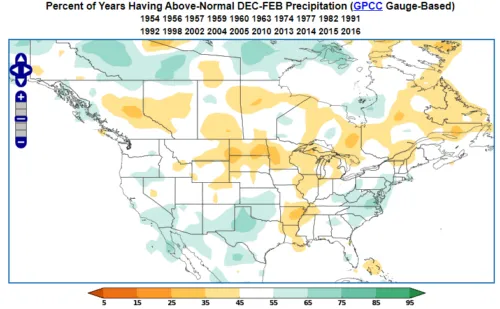
What are the US winter impacts of a negative IOD phase?
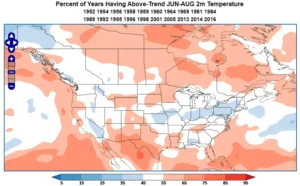
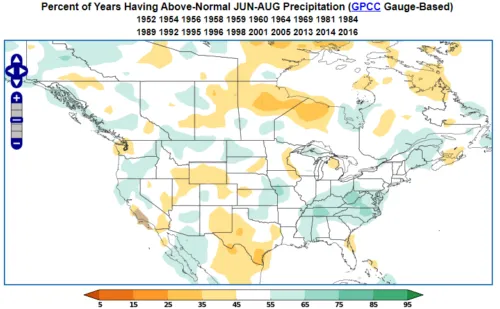
During winter, a negative phase of the IOD is generally associated with warmer-than-normal conditions across much of the lower 48, especially over the Midwest. In stronger negative events, those warm anomalies can become more widespread.
Although this pattern often resembles a La Niña background state, there are important differences. In some parts of the central United States, a negative IOD can favor anomalies opposite to what is typically expected from La Niña alone.
During winter, a negative IOD also tends to favor wetter-than-normal conditions in parts of the South and West, while the Midwest is more likely to be drier than normal.
Figure 6. World Climate Service temperature probability map for a negative Indian Ocean Dipole in winter
Figure 7. World Climate Service rainfall probability map for a negative Indian Ocean Dipole in winter
What are the US summer impacts of a negative IOD phase?
In summer, the negative IOD signal is weaker across the United States. The maps below suggest a more mixed pattern, with fewer robust nationwide impacts.
That said, the Mid-Atlantic is often somewhat cooler and wetter than normal, while Texas is often warmer and drier than normal during negative IOD summers.
Figure 8. World Climate Service temperature probability map for a negative Indian Ocean Dipole in summer
Figure 9. World Climate Service rainfall probability map for a negative phase Indian Ocean Dipole in summer
What is the Neutral Phase of the IOD?
A neutral IOD occurs when the temperature contrast between the western and eastern Indian Ocean is close to normal. In this phase, the DMI is near zero and the Indian Ocean Dipole is not a strong standalone driver of climate anomalies.
This phase matters because many users want to know whether the Indian Ocean is actively contributing to forecast risk or whether other climate drivers, such as ENSO, are likely to play the larger role.
What is the Positive Phase of the IOD?
The positive phase of the IOD is associated with warmer-than-normal sea surface temperatures in the western Indian Ocean and cooler-than-normal sea surface temperatures near Indonesia. This pattern reverses the usual circulation across the basin and tends to suppress convection over Indonesia while enhancing it farther west.
The result is often drier-than-normal weather over Indonesia and parts of Australia, together with wetter conditions over the Horn of Africa. In broad terms, this phase is consistent with El Niño-like behavior in the tropical climate system.
Figure 10. The positive phase of the IOD reverses the usual circulation over the Indian Ocean
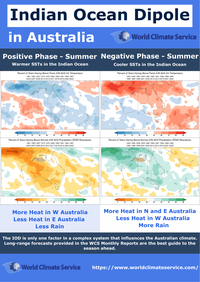
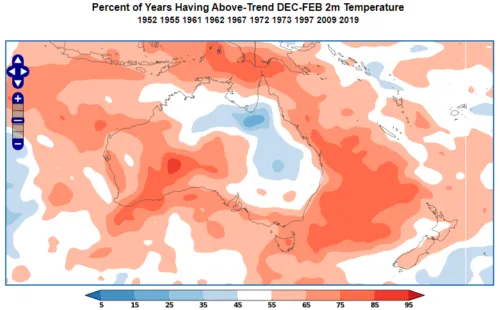
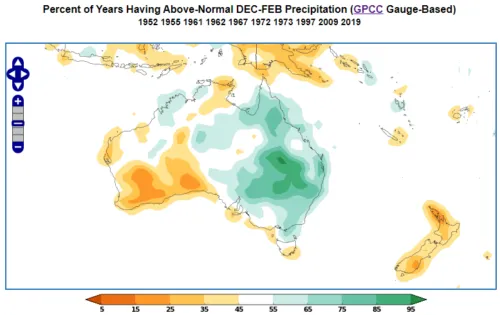
What are the Australian winter impacts of a positive IOD phase?
In winter, a positive IOD is often associated with warmer-than-normal conditions in Western Australia, while much of the rest of Australia is cooler than normal.
At the same time, large parts of Australia tend to be drier than normal. That raises drought risk and can materially affect agriculture, water availability, and wildfire conditions.
Figure 11. World Climate Service temperature probability map for a positive Indian Ocean Dipole in winter
Figure 12. World Climate Service rainfall probability map for a positive Indian Ocean Dipole in winter
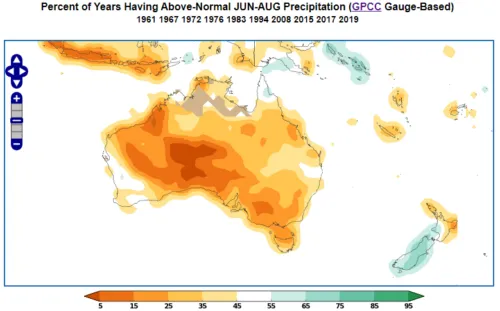
What are the Australian summer impacts of a positive IOD phase?
In summer, a positive IOD often favors warmer-than-normal conditions across much of Australia, although parts of the north and east interior can be cooler than normal.
Western Australia is often drier than normal during a positive IOD summer. Across other parts of the country, above-normal rainfall can increase flood risk.
Figure 13. World Climate Service temperature probability map for a positive Indian Ocean Dipole in summer
Figure 14. World Climate Service rainfall probability map for a positive Indian Ocean Dipole in summer
The World Climate Service system enables users to explore Indian Ocean Dipole impacts and many other indices by phase and month of year, with maps covering temperature, rainfall, and other weather parameters worldwide.
Why is the Indian ocean Dipole Important for Energy Meteorologists?
The Indian Ocean Dipole is especially important for energy meteorologists in Australia and Asia because it influences seasonal rainfall, temperatures, and drought conditions across those regions. Its effects also extend beyond the tropics into parts of the mid-latitudes, including Europe.
Because the IOD can remain in one phase for an extended period and is often predictable well in advance, it provides useful seasonal forecast context for weather-sensitive risk. It is usually most valuable when assessed alongside other large-scale climate drivers rather than in isolation.
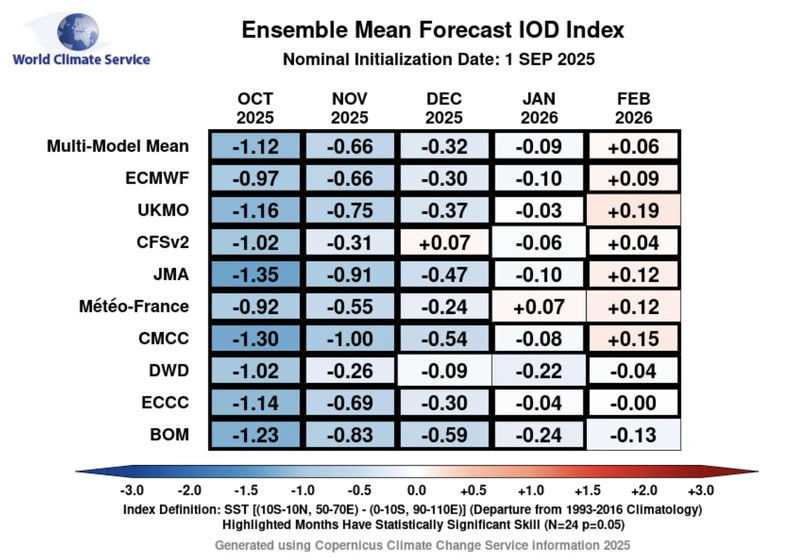
What is the Current Indian Ocean Dipole Forecast?
The current suite of seasonal climate forecast models processed by the World Climate Service indicates whether the Indian Ocean Dipole is likely to remain positive, negative, or neutral over the coming months.
This forecast matters because the IOD is often well predicted by dynamical modeling, making it one of the more useful large-scale climate drivers in seasonal forecasting.
When interpreting the forecast, pay attention to:
– whether the expected phase is positive, negative, or neutral
– how long the event is forecast to persist
– whether different models agree on the phase
– whether forecast skill is statistically significant
Figure 15. World Climate Service chart of the Indian Ocean Dipole forecast issued in September 2025, determined from Copernicus seasonal forecast models
When Does the Indian Ocean Dipole Usually Develop and Peak?
The Indian Ocean Dipole often develops during the second half of the year and can remain influential for several months. Its timing does not always match ENSO exactly, which is one reason the IOD can add important independent value to seasonal forecasting.
Knowing when the IOD tends to develop, strengthen, peak, and weaken is important because the same phase can have very different practical implications depending on the season.
What is the Vital Role of the IOD in Seasonal Forecasting?
The Indian Ocean Dipole is fundamentally tied to sea surface temperatures in the Indian Ocean and can be viewed as the Indian Ocean branch of the Walker circulation.
Because IOD phases often persist for many months and are generally well predicted by dynamical models, the IOD is a vital part of seasonal forecasting across both the tropics and the mid-latitudes.
For forecasters, traders, and risk managers, the IOD is most useful when it is interpreted together with ENSO, the SOI, and other large-scale climate drivers. Used in that broader context, it can materially improve seasonal climate interpretation.