Indian Ocean Dipole in 2019
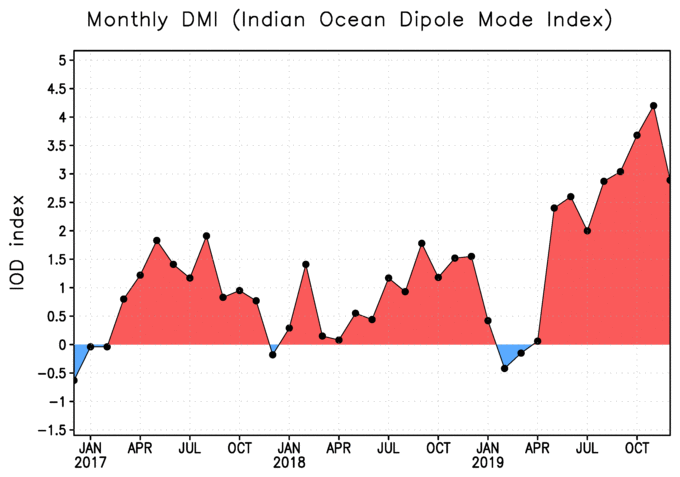
The strongly positive phase of the Indian Ocean Dipole (IOD) was one of the most striking features of global climate variability of 2019. The IOD is a mode of coupled ocean-atmosphere variability in the Indian Ocean, and it has strong impacts on climate anomalies in the surrounding areas and farther afield. See here for a review article:
Starting in May 2019, a strongly positive phase of the Indian Ocean Dipole developed, and the IOD anomaly persisted and intensified to unprecedented levels by early Northern Hemisphere winter.

Strong departures from normal in major climate phenomena worldwide often provide a useful source of predictability for seasonal climate, and this is especially true for major tropical ocean anomalies. For example, World Climate Service forecast discussions began alluding to the IOD anomaly in summer 2019, and the positive IOD phase was an important forecast consideration through the rest of the year, even for regions as far away as Europe.
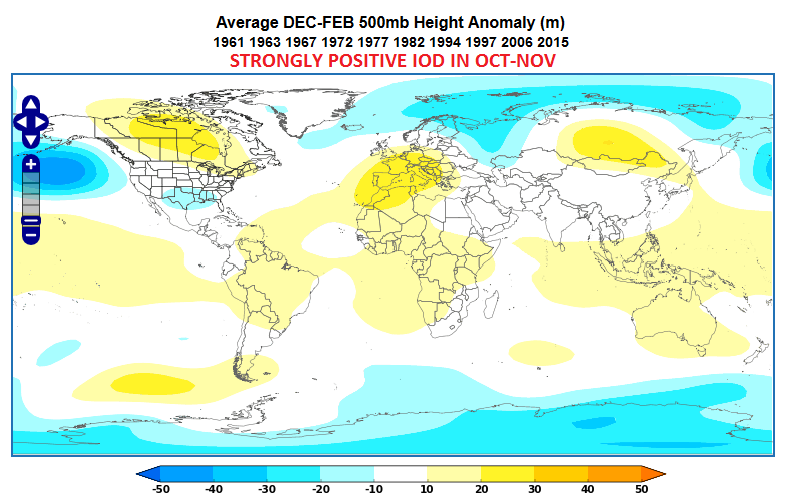
As a simple example, consider the history of past winters that were preceded by a strongly positive Indian Ocean Dipole phase during late autumn; such winters tend to have a predominantly positive Arctic Oscillation, with a trough over northern Eurasia and a ridge over southern Europe.
This pattern favors a persistently warm outcome for northern Europe, and this signal provided useful insight for the World Climate Service winter seasonal climate forecast. (However, it’s also worth noting that the strongest positive IOD episodes tend to occur during strong El Niño events, and this complicates the analysis, as discussed in the WCS seasonal forecast report.)

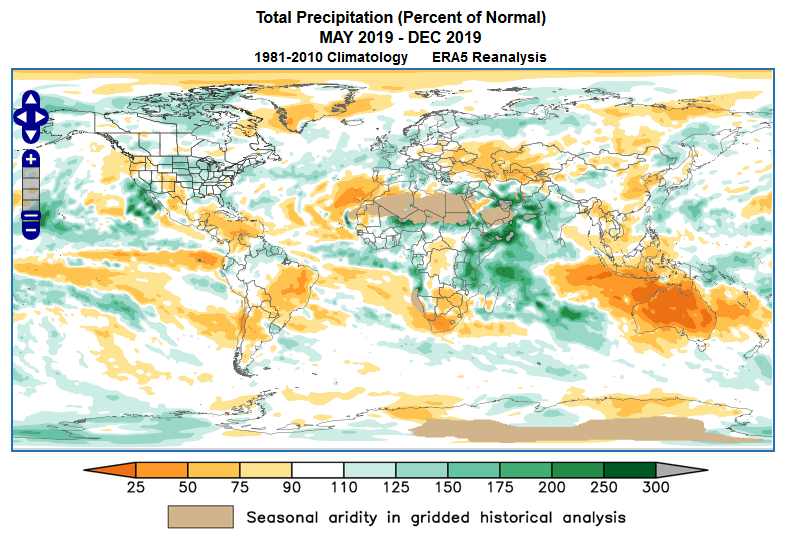
Looking back at the past several months, it is abundantly clear that the positive IOD phase was the key driver of the major climate anomalies that affected eastern Africa, Australia, and elsewhere. Australia was afflicted by severe drought and heat, leading to extreme fire conditions by late 2019, while East Africa has seen flooding rainfall and, more recently, the worst locust outbreak in 25 years.
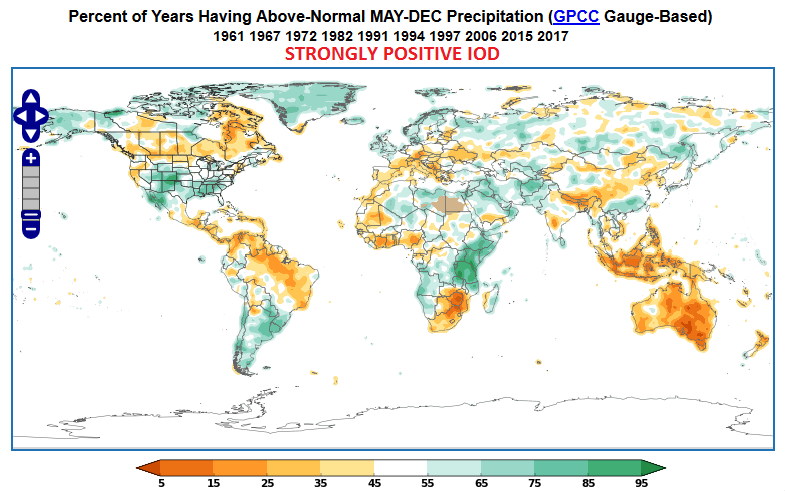
To visualize the impact of the IOD anomaly, the first map below shows the typical precipitation patterns that accompany a strongly positive IOD phase in May through December, and the second map shows the observed departure from normal in 2019, according to the ERA5 reanalysis. These maps are readily obtained on the World Climate Service portal. Drought tends to occur in Australia, Indonesia, and southern Africa during strongly positive IOD episodes, but above-normal rains are common in eastern Africa, and May-December 2019 saw all of these patterns prevail, leading to widespread important impacts in these areas. One of the most notable impacts was an outbreak of locusts in eastern Africa, and this highlights a real-world application of World Climate Service forecasts; the WCS supports the UN FAO mission to manage locust outbreaks.


In summary, the extremely positive IOD episode of 2019 was a primary climate driver for large portions of the tropics and Southern Hemisphere, and it is very likely that IOD-related forcing has affected circulation anomalies elsewhere across the globe in recent months.
From a forecast perspective, the pronounced IOD episode creates a “forecast of opportunity” situation, meaning that confidence is enhanced during periods of higher predictability. The World Climate Service provides tools to monitor and understand phenomena such as the IOD and associated impacts, and this information should be fully integrated into any long-range climate forecast process. The World Climate Service provides tools to enable the monitoring, analysis, and prediction of seasonal conditions.
The World Climate Services is an online toolset that provides subseasonal and seasonal forecasts. It also enables meteorologists to improve their long-range forecasting process by providing the wide range of information necessary to do so. We offer trials of the World Climate Service. You can request one here.