Do you remember the year with two springs? December 2015 was so warm that even the plants were confused and flowers bloomed in the Eastern United States in December. The Western Pacific index became strongly positive and made a significant contribution to the record-breaking warmth felt across every state east of the Mississippi River.
In this article, we investigate the Western Pacific Oscillation (often referred to as simply the WPO): what it is, how it impacts the weather, and how we can use it in long-range forecasting.
What is the Western Pacific Oscillation (WPO)?
The Western Pacific Oscillation is one of many cyclic phenomena (climate indices or teleconnections) that describe the atmospheric flow pattern over the Northeast Pacific sector; it is a near neighbor to the PNA and EPO. The WPO can shape the weather across North America with characteristic patterns in evidence at different times of the year. Check out and click on the Western Pacific Oscillation (WPO) quick summary PDFs for:
What is the Current Value of the Western Pacific Oscillation (WPO)?
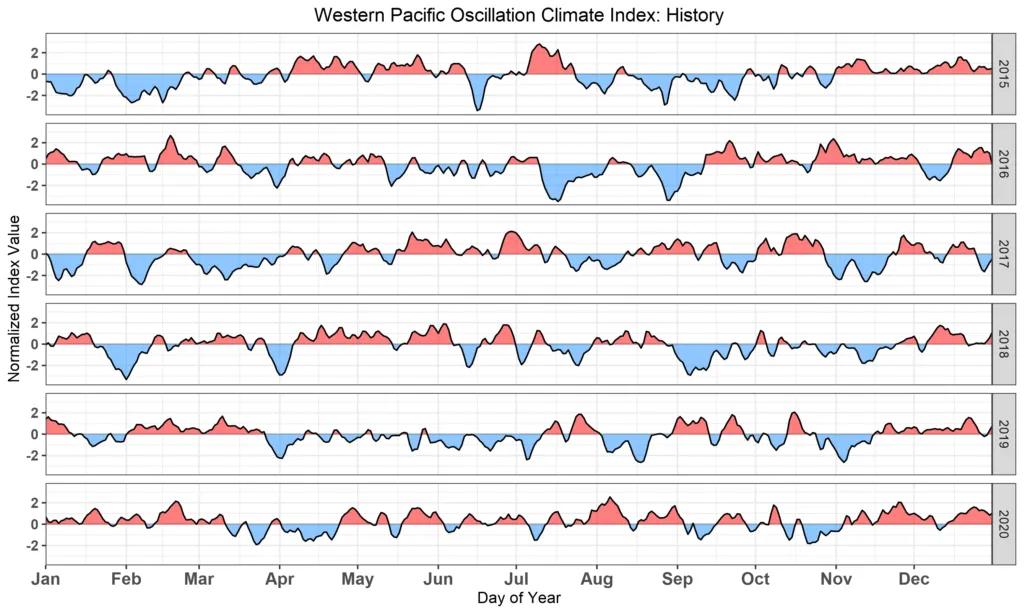
The current value of the WPO is displayed in Figure 2.
The Positive Phase of the Western Pacific Oscillation
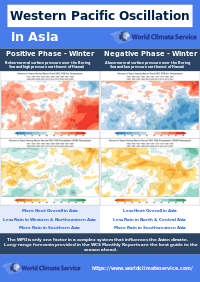
World Climate Service provides a powerful data mining system that enables users to quickly explore the Western Pacific Oscillation, and many other indices, by phase for each month of the year, showing impacts on all the major weather variables right around the globe.
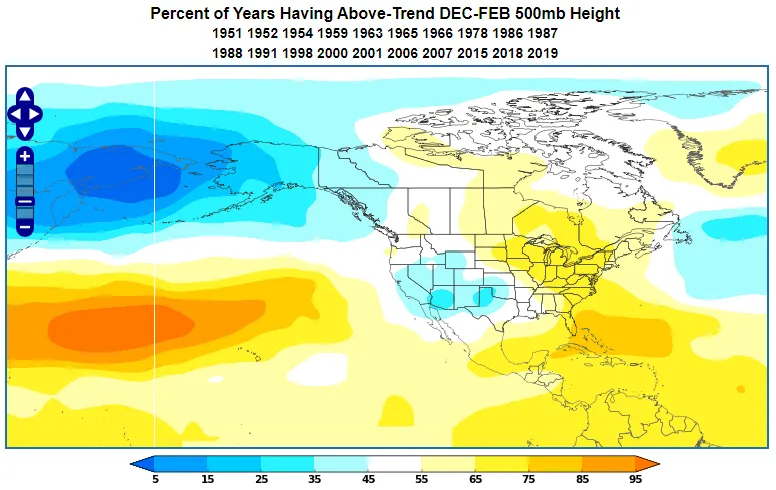
The WPO is largely driven by the pressure pattern over the Bering Sea, which forms a dipole with the pressure over the Pacific northwest of Hawaii. Figure 3 shows that a positive WPO occurs when low pressure is resident over the Bering Sea and high pressure is northwest of Hawaii. Downstream over the US, we see troughing in the Southwest, with ridging over the Midwest and the East.
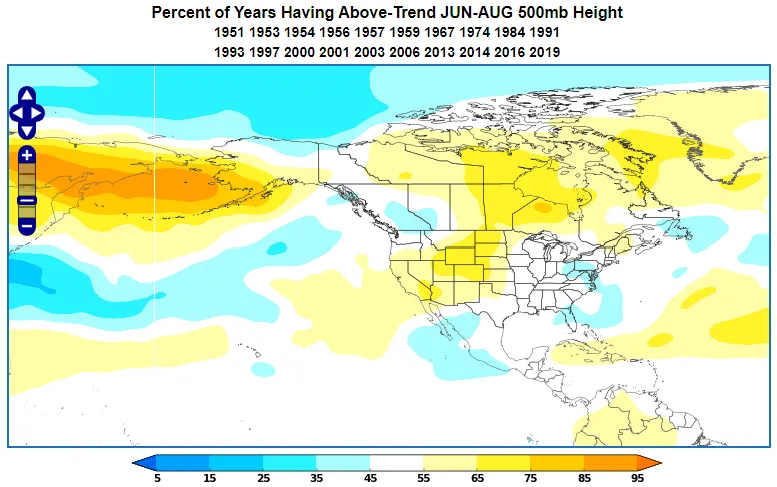
A positive WPO in summer (Figure 4) displays a similar set up to the winter pattern over the Pacific, but we do see a different pattern over the lower 48 states. A positive WPO in summer is associated with troughing over most of CONUS, but ridging is more likely over Texas and Florida.
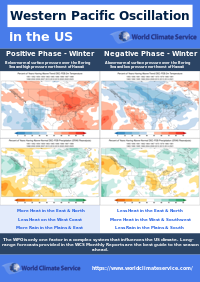
Western Pacific Oscillation – Positive Phase Impacts in Winter
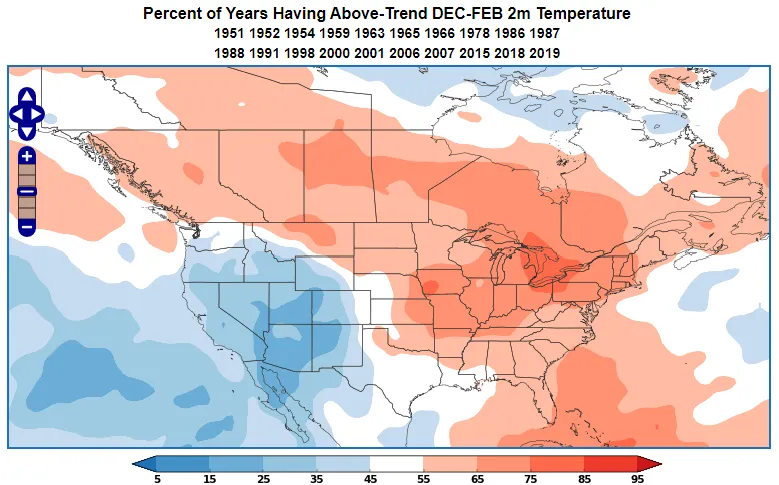
As we witnessed in December 2015, during the positive phase of the WPO in the wintertime, the North and East are usually warmer than normal. At the same time the Rockies and the West are more likely to see a cooler than normal winter (Figure 5).
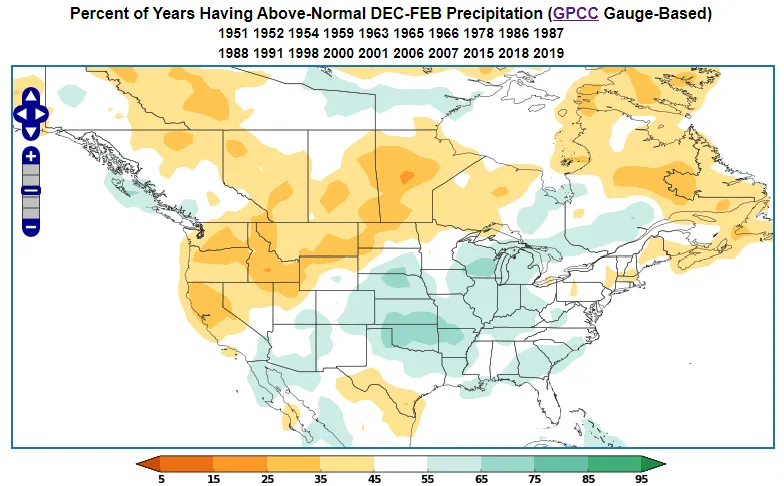
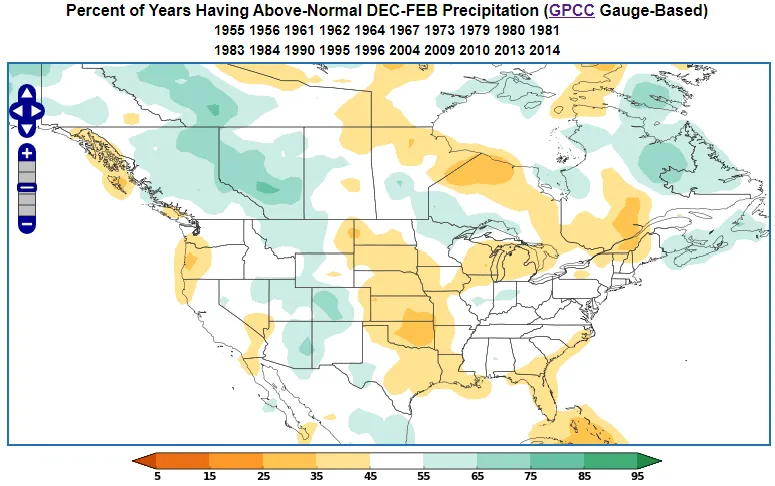
The positive phase of the WPO brings wet winters to many Central and Southeastern areas. Meanwhile the Northwest and the Northeast usually collect less rainfall than normal (Figure 6).
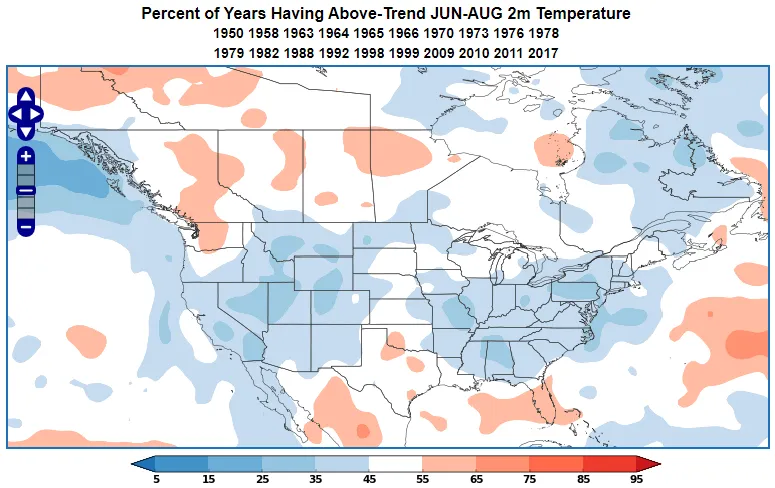
Western Pacific Oscillation – Positive Phase Impacts in Summer
Temperatures across much of the United States are much more likely to remain below normal when the summer WPO is positive. Only a few spots in Texas and Washington state are more likely to experience warmer than normal summers (Figure 7).
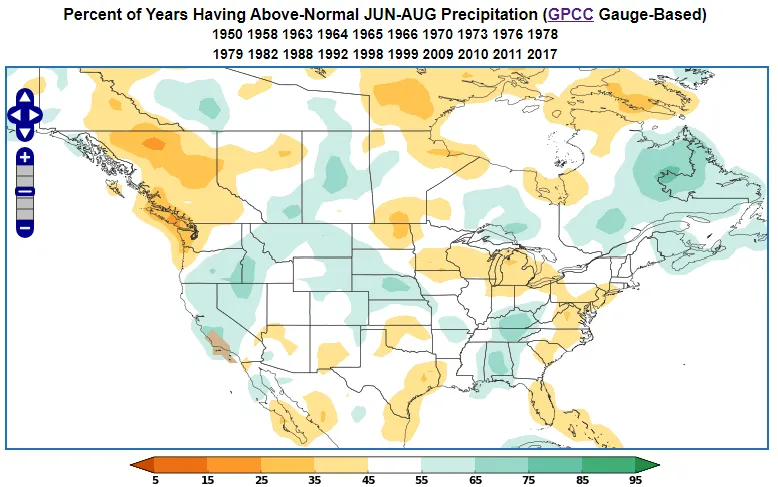
Positive WPO summers are characterized by excess rainfall from California to the Northern Rockies, as well as over Nebraska and Alabama (Figure 8). Meanwhile, drier than normal summers are normally experienced over The Great Lakes and the East.
The Negative Phase of the Western Pacific Oscillation
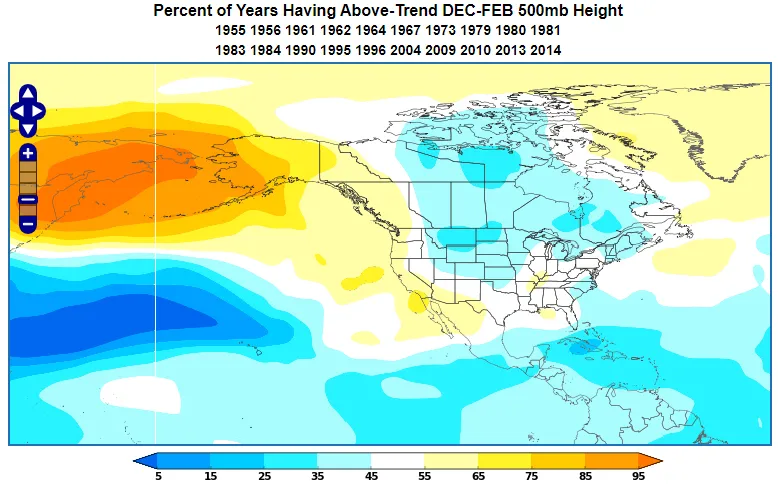
The negative phase of the WPO is essentially a mirror image of the positive phase, with high pressure centred on the Bering Sea and low pressure towards Hawaii (Figure 9). We usually see ridging on the West coast and troughing over the Northern Plains.
In the summer, ridging usually sets up from California to the Northern Plains, while there is a slight preference for troughing in the East (Figure 10).

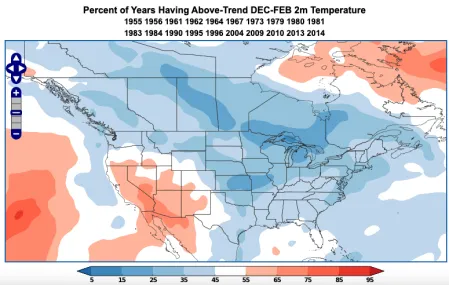
Western Pacific Oscillation – Negative Phase Impacts in Winter
During the negative phase of the WPO in wintertime, most of the lower 48 states are usually colder than normal. The exception is the Southwest which where winters are often warmer than normal (Figure 11).
At the same time, the Rocky Mountains are likely to be wetter than normal. Other areas generally have equal chances of wet or dry winters, but the Great Plains usually collect less rainfall than normal (Figure 12).
Western Pacific Oscillation – Negative Phase Impacts in Summer
The negative WPO does not influence the temperature across CONUS in summer in a big way. Nevertheless, locations immediately east of the Rockies are more likely to be warmer than normal (Figure 13).
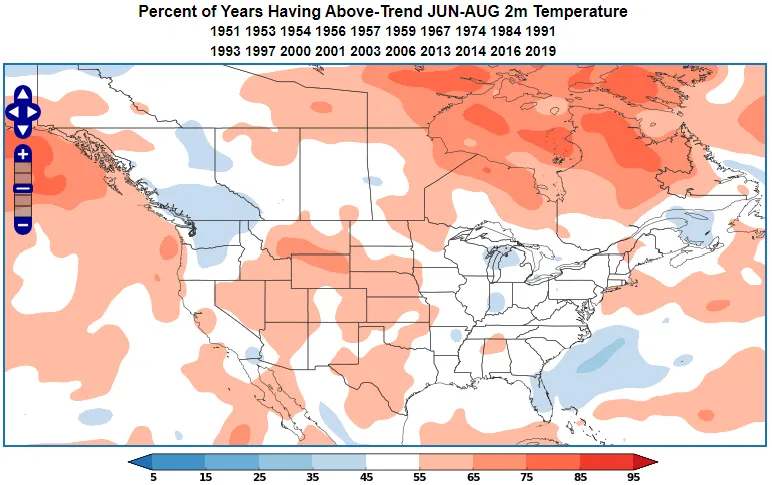
Figure 13. World Climate Service temperature probability for a negative Western Pacific Oscillation in summer
The negative Western Pacific Oscillation in summer is likely to bring anomalous rainfall to the Mid-Atlantic and the desert Southwest. Meanwhile, the Northern Rockies, Texas and the Plains are liable to be drier than normal (Figure 14).

Long Range Forecasting and the Western Pacific Oscillation
The Western Pacific Oscillation typically remains one of its phases anywhere from a few days to a few weeks. One of the reasons that the WPO has high variability is that it is modulated by the tropical Madden-Julian Oscillation, which has an irregular 42-day cycle.
Thus, the WPO is very much a subseasonal climate phenomenon (as opposed to a longer-lasting seasonal climate cycles such as ENSO and the SOI). Occasionally the subseasonal long-range forecast models will indicate a high probability of one phase or the other with a two- or three-week lead time. If there is cross-model support, then a long-range forecaster can start to think about what typically happens for that phase of the WPO at this time of year. Fortunately, the World Climate Service provides the forecaster with the tools to do so.

Concluding Remarks about the Western Pacific Oscillation
The Western Pacific Oscillation is a pressure dipole that exists between the Bering Sea and the Pacific northwest of Hawaii that influences the pattern downstream across much of North America. The WPO is a subseasonal phenomenon which rarely persists in one phase for more than a week or two.
The Western Pacific Oscillation is an important driver of US climate variability, as demonstrated by the exceptional warmth east of the Mississippi that closed out 2015. Predictions of the WPO can be an important consideration in subseasonal prediction because it creates characteristic weather patterns that change with time of year over the lower 48 states.