The Madden-Julian Oscillation is a tropical phenomenon providing a critical source of subseasonal predictability in the midlatitudes. If you’ve asked yourself “What is the Madden-Julian Oscillation” then you are not alone, as many meteorologists preparing a subseasonal forecast have asked themselves that very question, oftentimes more than once. In this article we attempt to explain the remarkable Madden-Julian Oscillation and its role in long-range forecasting.
The Madden-Julian Oscillation – Introduction
The Madden-Julian Oscillation is like nothing else on Earth. It was discovered in the early 1970s by Dr. Roland Madden and Dr. Paul Julian at the American National Center for Atmospheric Research (NCAR).
Madden and Julian noticed a 40-50 day oscillation in the winds over the tropical Pacific. Their investigations revealed a large-scale tropical atmospheric convective cell which is characterized by an area of deep convection flanked on both sides by areas of dry, clear, sinking air.
And if that wasn’t interesting enough, they found that the whole circulation travels west to east in a rapid 30 to 60 day orbit around the globe.
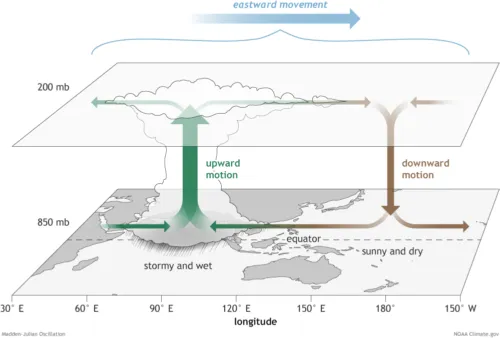
Fig. 1: Schematic diagram of the MJO convective circulation (Credit NOAA)
The Madden-Julian Oscillation – Behavior
The exact location of the MJO can be difficult to discern. First, it is not always active; it can lie dormant for long periods, especially during El Nino events, and generally through the Northern Hemisphere summer months. When the MJO bursts into convective action, the sinking portion of the circulation must also be in evidence for the MJO to rank as being active.
Second, the MJO plays out against a backdrop of other convective patterns such as ENSO. Sometimes this interference is destructive and the coherence of the MJO circulation is temporarily lost. The circulation can also fade as activity crosses the cooler waters of the Eastern Pacific.
Thus the easterly progress of the MJO is rarely smooth as we can see in Figure 2: a Hovmöller plot of 200 mb velocity potential observations (velocity potential is a measure of divergence in the 200mb wind field – showing the areas of strong and weak convection). We see that over time the alternate areas of strong (green areas highlighted with red lines) and suppressed (brown) convection move west to east.
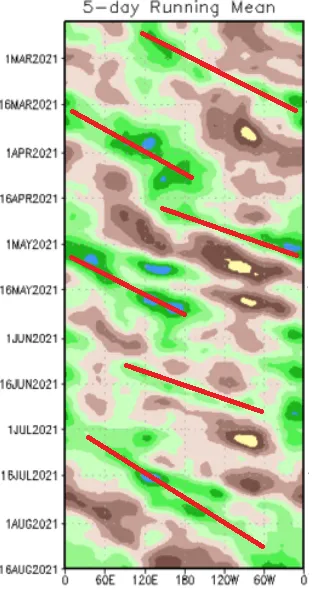
Fig. 2: 200 mb velocity potential observations March to August 2021 (Credit NOAA)
The Madden-Julian Oscillation – Measurement
The strength and position of the MJO are usually defined by two meteorological components known as RMM1 and RMM2, where RMM means Real-Time Multivariate MJO Index Series 1/2. They are:
1) satellite measurement of outgoing longwave radiation (OLR). OLR is large when skies are clear, and small when thick cloud is present. The juxtaposition of large and small OLR contributes to the classification of the MJO.
2) the strength of the east-west component of the wind field at 850mb and 200mb.
The position and strength of the MJO is usually presented as a point on a Wheeler-Hendon diagram, a convenient climate index to describe its evolution .
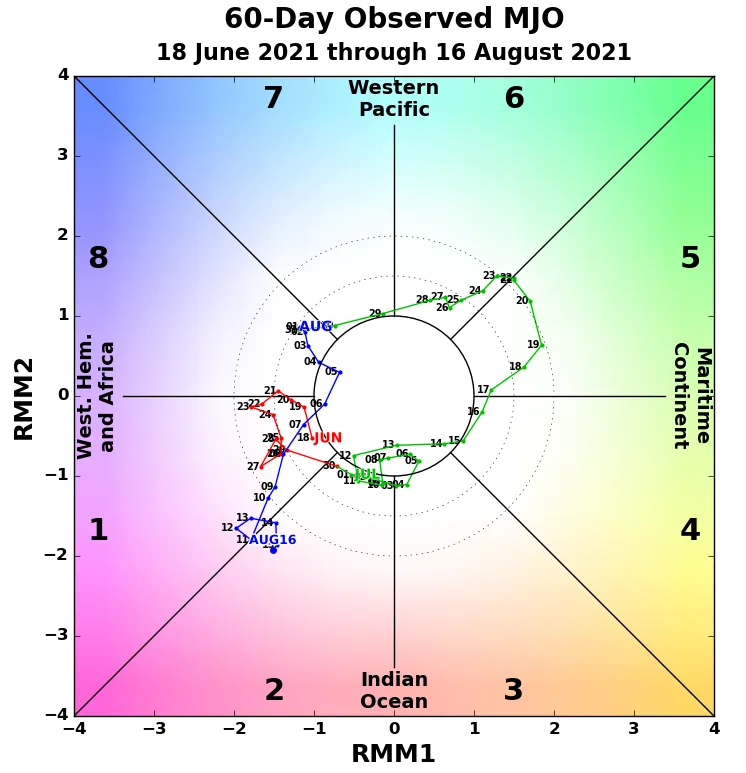
Fig. 3: World Climate Service MJO observations for June, July, August 2021
The circles around the center represent the strength of the MJO – the higher the number (the farther from the centre), the stronger the MJO convective activity. Within the center region the MJO is considered inactive. The quite faint inner dashed circle equates to a strength of 1.5 and the outer 2.
The diagram is split into 8 sectors, or phases, which represent different regions of the globe. So just as you thought the MJO couldn’t get any weirder, it turns out that the phases do not cover equal areas of the globe!
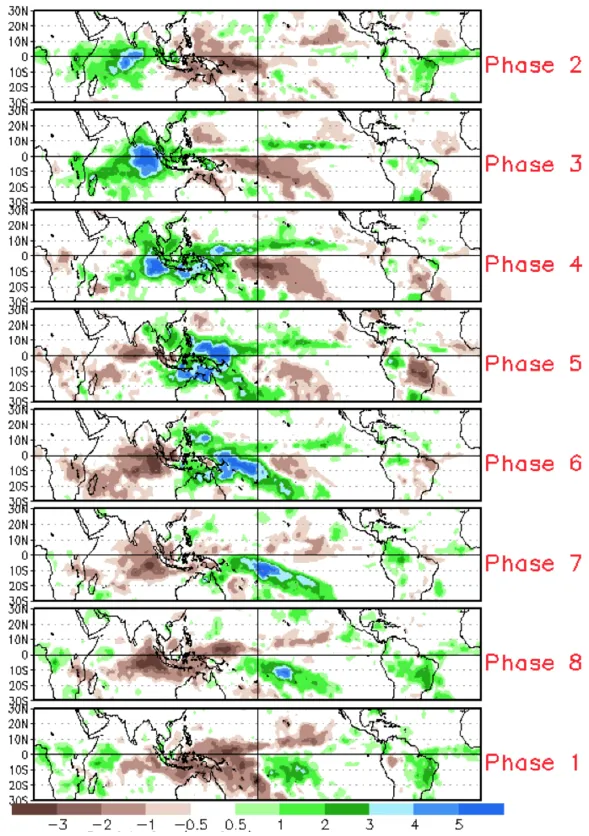
Fig. 4: average November to March rainfall anomaly all MJO events from 1979-2012 for each phase of the MJO (Credit NOAA)
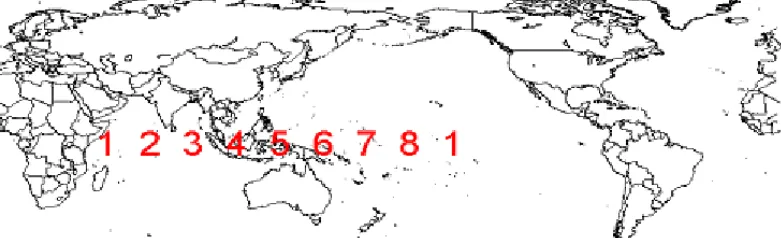
Fig. 5: the location of each MJO phase based on peak convection
The MJO produces a relatively coherent area of convection when traveling across the Indian Ocean and into the Pacific as far as the dateline. These are phases 2 through 7. Once past the dateline, the convection becomes stretched across favored parts of the Western hemisphere and Africa, so phases 1 and 8 cover a similar geographical expanse as all the other phases combined.
The Madden-Julian Oscillation – Impacts
The active MJO alters weather patterns over much of the Earth. Although the MJO is defined in the tropics, its effects are often felt deep into the mid-latitudes. The effects include:
Tropics
- Changes distribution of cloud, rainfall, and wind.
- Modulates monsoonal rains
- Enhances tropical cyclone development
Subtropics and Mid-latitudes
- Determines position and strength of jet streams
- Modifies US winter with higher risk of: heavy rain in the West and cold waves in the East
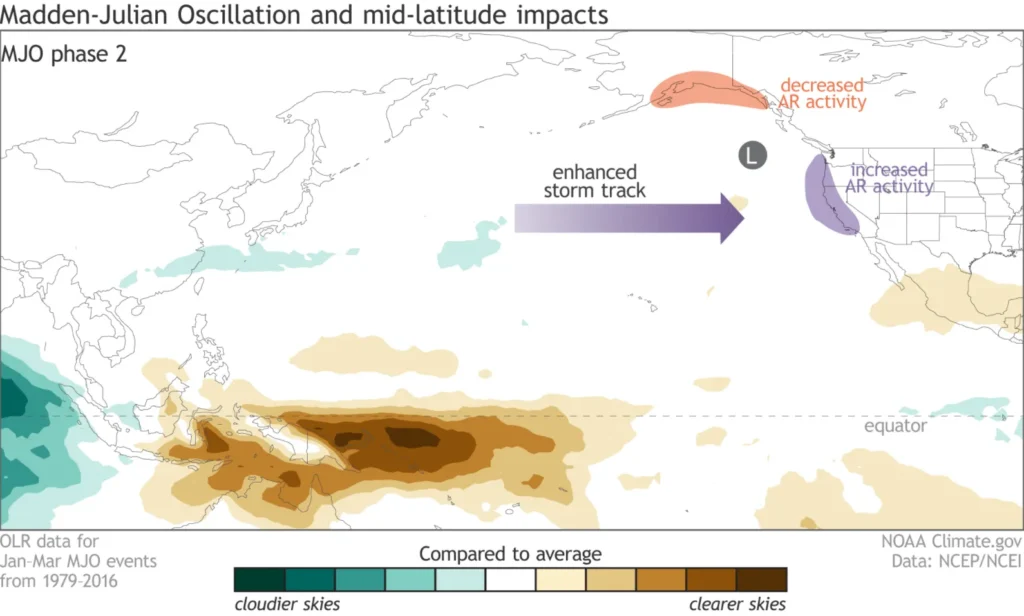
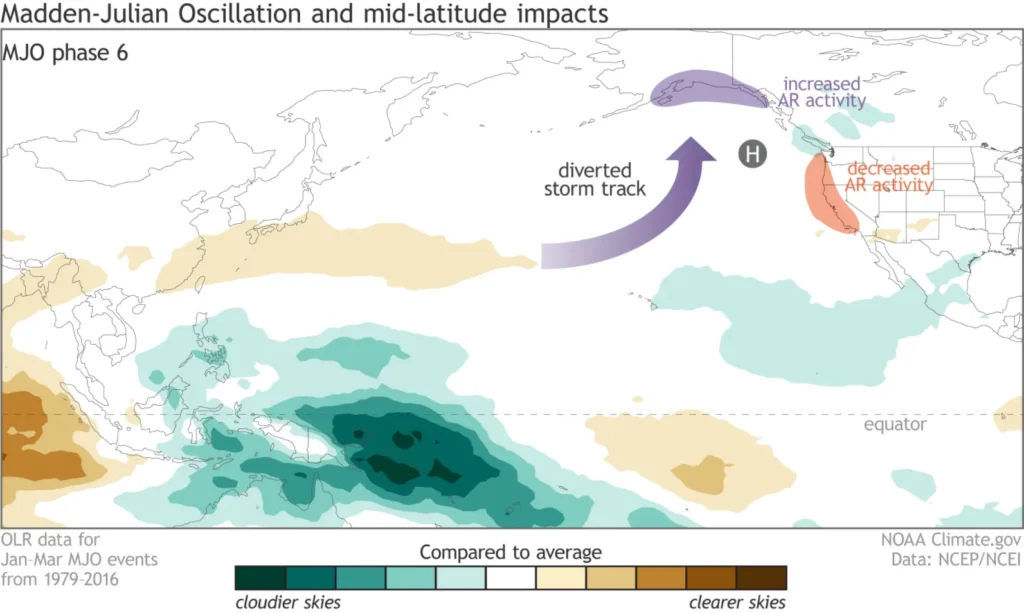
Fig. 6 (top) and Fig. 7 (lower): Diagrams showing how the phases of the MJO can affect the frequency of atmospheric river events (heavy rain) on the West coast
Predicting the Madden-Julian Oscillation
Dynamical models are able to skilfully predict the Madden-Julian Oscillation as far as 21 days into the future, which makes the MJO a valuable source of information in subseasonal prediction. It has also been shown that dynamical modeling is in general more skillful when the MJO is active at the time of initialization.
The World Climate Service provides subscribers with MJO forecasts from the GEFS, ECMWF, and CFSv2. Figure 7 shows an MJO forecast from the subseasonal GEFS model. In this case, the GEFS develops a strong orbit through phases 3-4-5-6 during the forecast period.
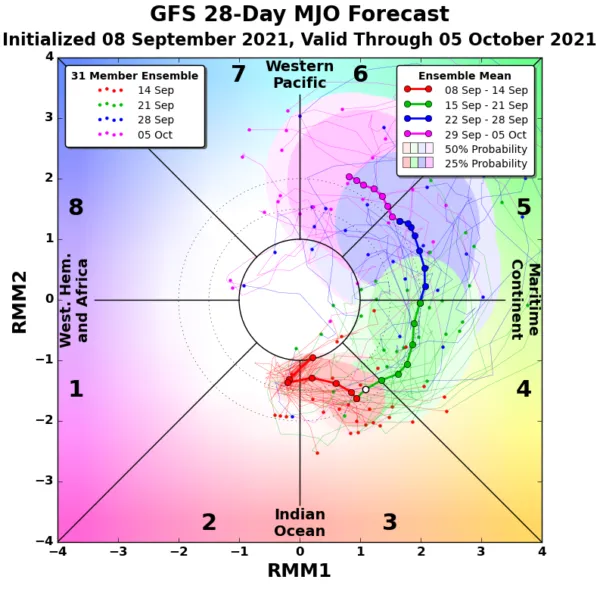
Fig. 7: WCS MJO forecast from the GEFS subseasonal model
It is always worth checking the output from more than one computer prediction model because the models sometimes display very different MJO evolutions despite similar initializations.
If WCS subscribers know which phase the MJO is most likely in the coming weeks, then they can use the World Climate Service analog forecast system to instantly show how a given phase of the MJO impacts various weather variables around the world at any time of the year.
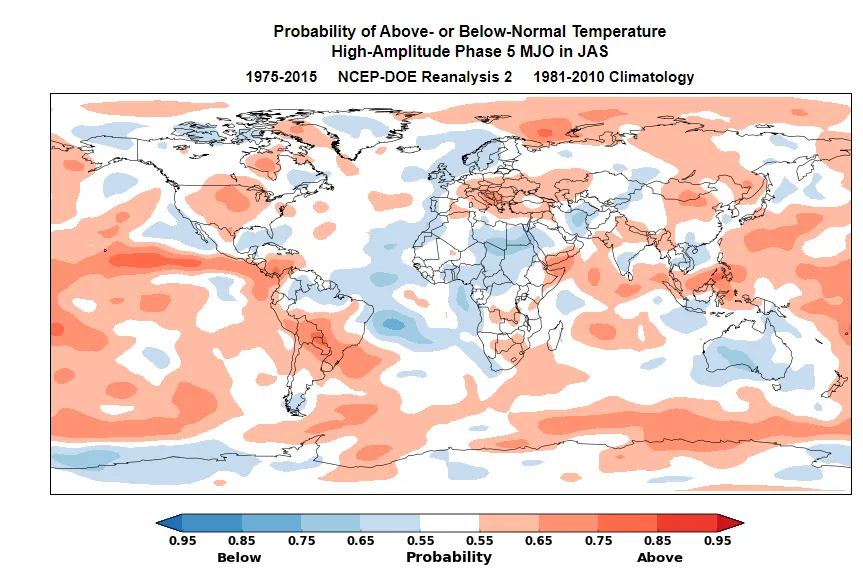
Fig. 8: WCS T2m analog map for MJO phase 5 in July/August/September
An intriguing MJO signal occurred in January 2021 which was discussed by Prescient Weather’s lead scientist, Richard James. The MJO forecast was of particular interest because it followed soon after a rare mid-winter warming of the stratospheric polar vortex (SPV).
Using the WCS data mining and analog creation system, Dr. James was able to produce an analog forecast which combined the MJO and SPV climate indices. This analog could then be compared and contrasted with the dynamical model forecast, giving additional insight on how the atmosphere may respond in the subsequent 4 weeks.
In the event, the analog was very close to the dynamical forecast but with key differences that added value to the forecast. Dr. James also showed that either of the signals in isolation would not have produced such an extreme forecast and that it was the combination of signals that was key in this event.
The Madden-Julian Oscillation – Conclusion
The Madden-Julian Oscillation is an intermittent wave of enhanced tropical convection that transits west to east through the entire tropics in 30 to 60 days.
The MJO can impact weather patterns across the tropics, subtropics, and mid-latitudes. As the MJO can persist for many weeks and is well predicted by dynamical modeling, it represents one of the most important considerations in subseasonal prediction.
Reference: https://www.climate.gov/news-features/blogs/enso/what-mjo-and-why-do-we-care