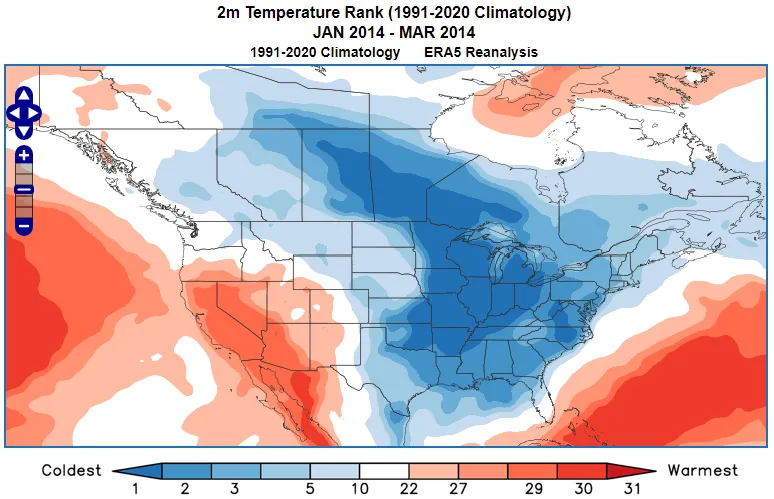
In this article we introduce the Northeast Pacific Mode, which made a significant contribution to the coldest January-March over the Midwest in the last 31 years (Figure 1) in 2014.
If you were one of the 187 million US residents living east of the Rockies in early 2014, there’s a good chance you were impacted by the exceptionally cold weather that arrived in the first week of January, and continued well into March. As highlighted by the USA Today, this was the time when the news media embraced the previously obscure term “polar vortex” and thereby permanently etched the phrase into the public consciousness. Unfortunately, that suggestion for the cause of the cold outbreak is not entirely correct.
The cold wave was partly due to a breakdown of the Stratospheric Polar Vortex, but the stage for severe cold weather was set much earlier by an equally obscure meteorological phenomenon known as the Northeast Pacific Mode. The NPM remains little known to the general public, and admittedly, it doesn’t sound nearly as sinister as the “polar vortex.”
*note World Climate Service anomalies are detrended. This means that any trend in the data between 1950 and 2020 is removed, and thus the resulting anomalies are only associated with the NPM phase specified.
What is the Northeast Pacific Mode?
The Northeast Pacific Mode is a cyclical phenomenon of sea surface temperature anomalies in the Northeastern Pacific Ocean. Like the Pacific Decadal Oscillation, the NPM can influence weather conditions across North America, with characteristic patterns occurring at different times of the year. This makes it also important for long-range forecasting of North American conditions. Check out and click on the Northeast Pacific Mode (NPM) quick summary PDFs for the:
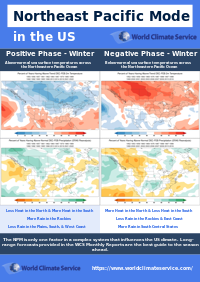
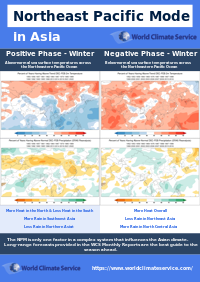
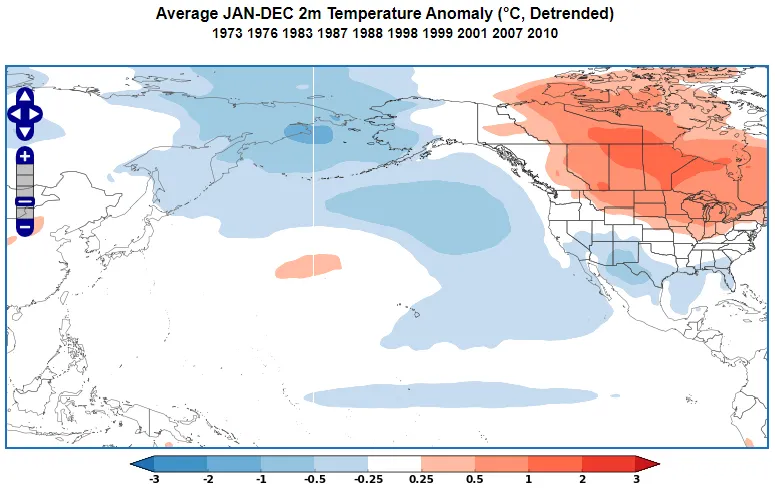
The NPM climate index oscillates irregularly between positive and negative phases. The positive phase is characterized by warmer than normal waters in the Gulf of Alaska and near the North American coast (Figure 2). The negative phase is a mirror image with cooler than normal waters in the Gulf of Alaska and off the western coast of North America (Figure 3).
World Climate Service has developed a powerful data mining system that enables users to quickly explore the Northeast Pacific Mode, and many other climate indices, by phase for each month of the year, showing impacts on all the major weather variables right around the globe.
What is the Current Value of the Northeast Pacific Mode (NPM)?
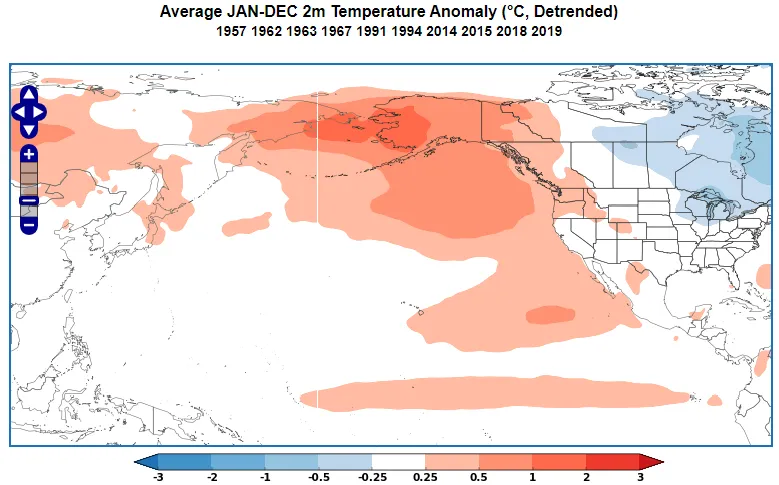
The current value of the NPM is displayed in Figure 4.
Positive Northeast Pacific Mode – Impacts
Winter
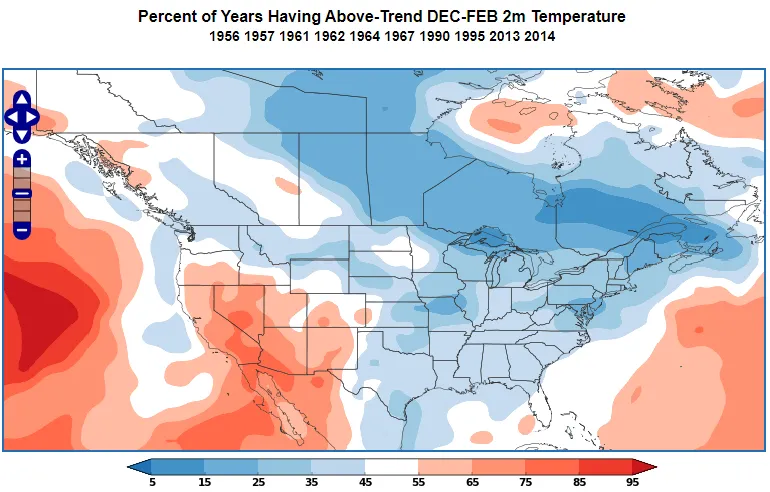
During the positive phase of the NPM in the Northern Hemisphere wintertime, much of CONUS usually experiences below normal temperatures, with only the Southwest likely to be warmer than normal (Figure 5). This was certainly the case during the infamous winter of 2013-14.
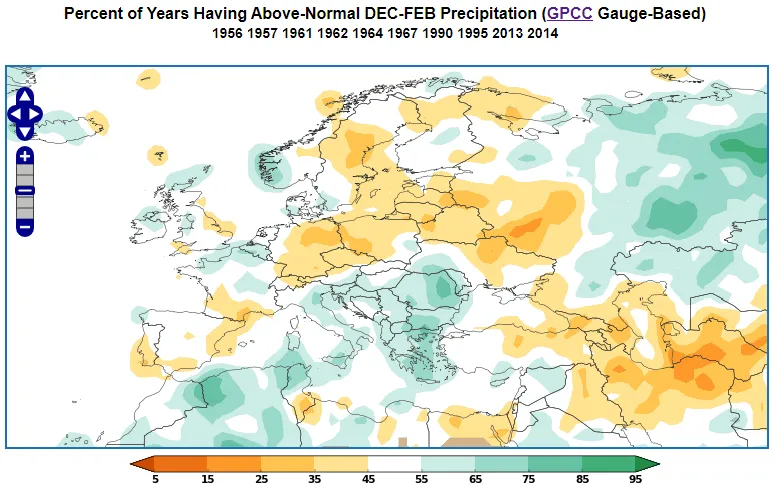
The effects of the Northeast Pacific Mode can be felt across large parts of the globe. A positive NPM in winter is more likely to result in dry weather over Northeastern Europe and the Middle East, whereas the Balkans usually see anomalous rainfall (Figure 6).
Summer
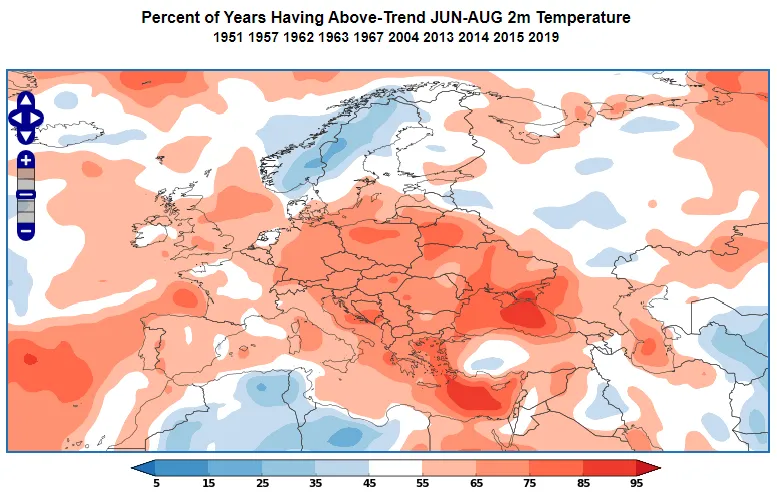
During the positive phase of the NPM in the Northern Hemisphere summer, much of Europe is usually warmer than normal. Only Western Scandinavia is more likely to be cooler than normal (Figure 7).
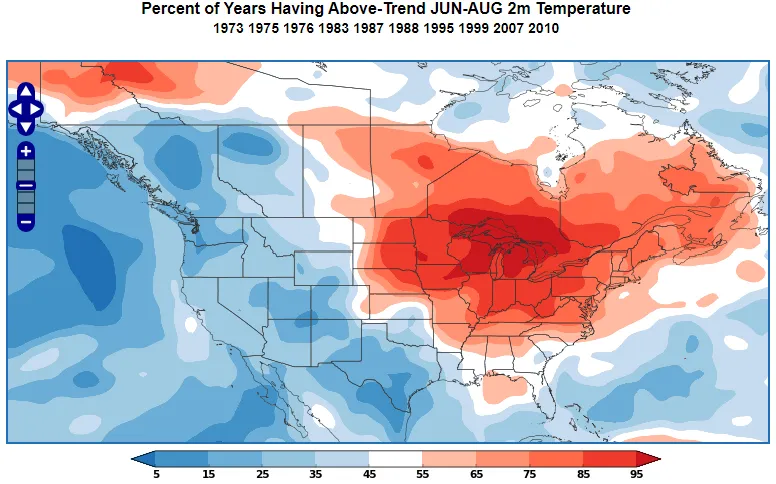
When the NPM is positive during the summer months Texas and the Pacific NW are very likely to be drier than normal. At the same time, the Central and Eastern US usually collects above normal rainfall (Figure 8).
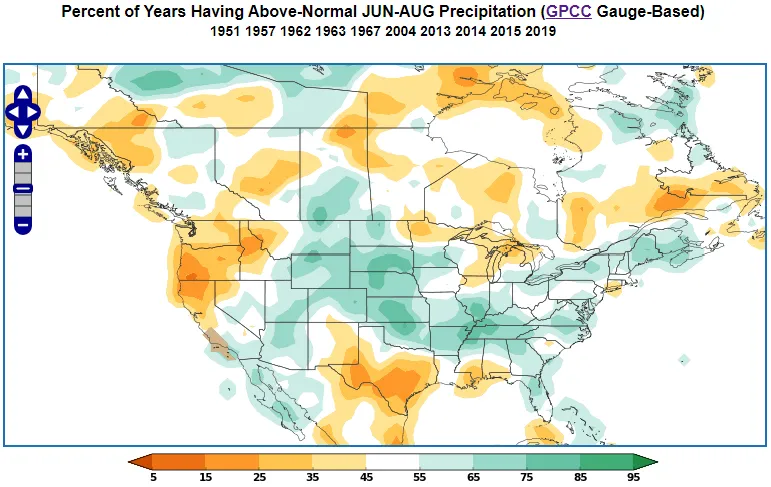
Figure 8. World Climate Service rainfall probability map for a positive North Pacific Mode in summer
Negative Northeast Pacific Mode – Impacts
Winter
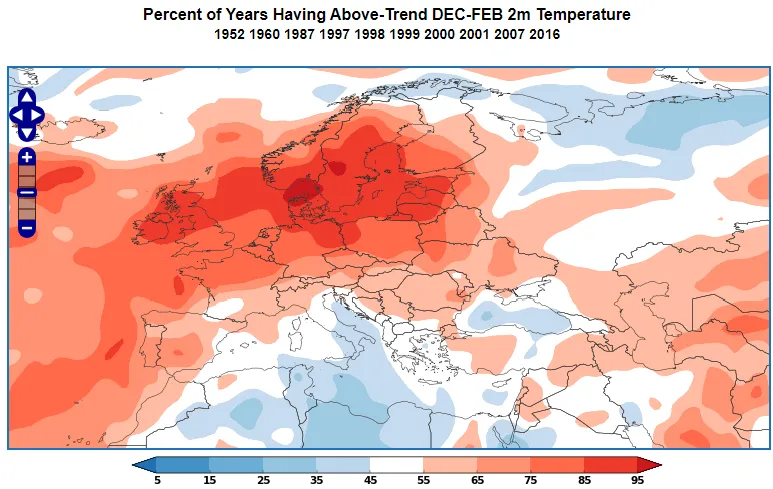
The negative phase of the NPM has a surprisingly strong impact on Europe in the wintertime. As a result, much of Northern Europe is very likely to be warmer than normal. Only the Central Mediterranean is usually colder than normal (Figure 9).
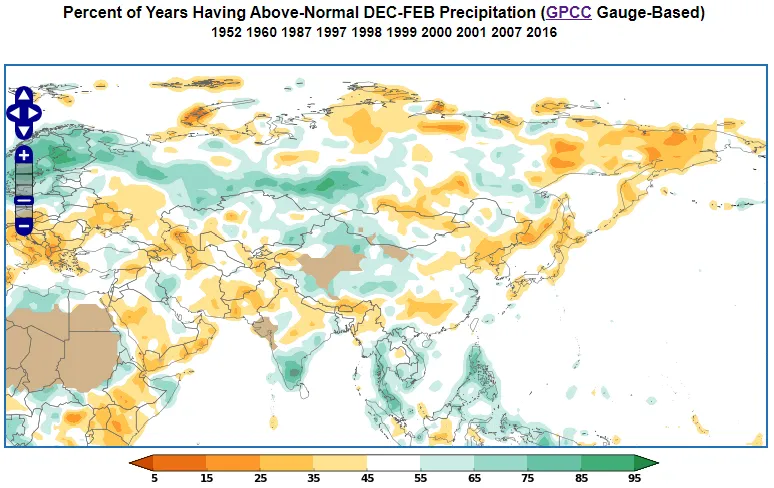
The negative phase of the NPM can also impact Asia in winter. Figure 10 shows a tendency toward drier than normal weather across Japan and large parts of China. In contrast, Eastern China and Southeast Asia tend to be wetter than normal.
Summer
During the negative phase of the NPM in the Northern Hemisphere summer, much of the Eastern and Central US is likely to be warmer than normal, particularly in the Midwest (Figure 11). At the same time, there is a strong tendency for cooler than normal weather on the western side of the Rockies.
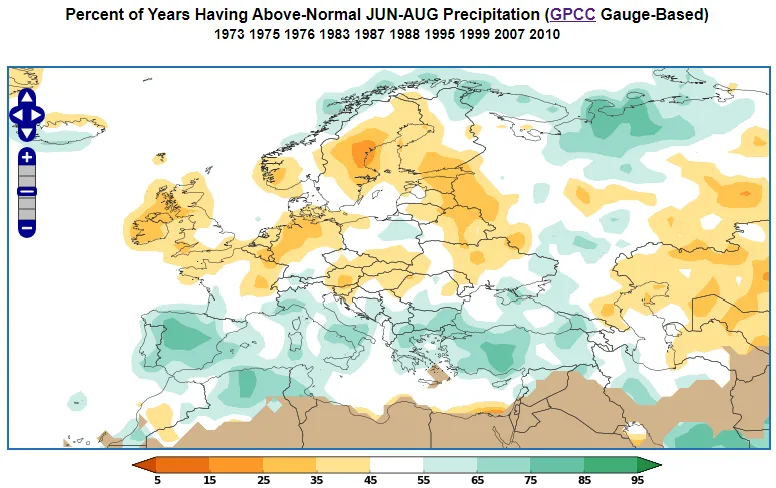
On the other side of the Atlantic, a negative NPM usually leads to dry summers across the north of Europe. Conversely, Southern Europe is often wetter than normal (Figure 12).
Northeast Pacific Mode and Long-Range Prediction
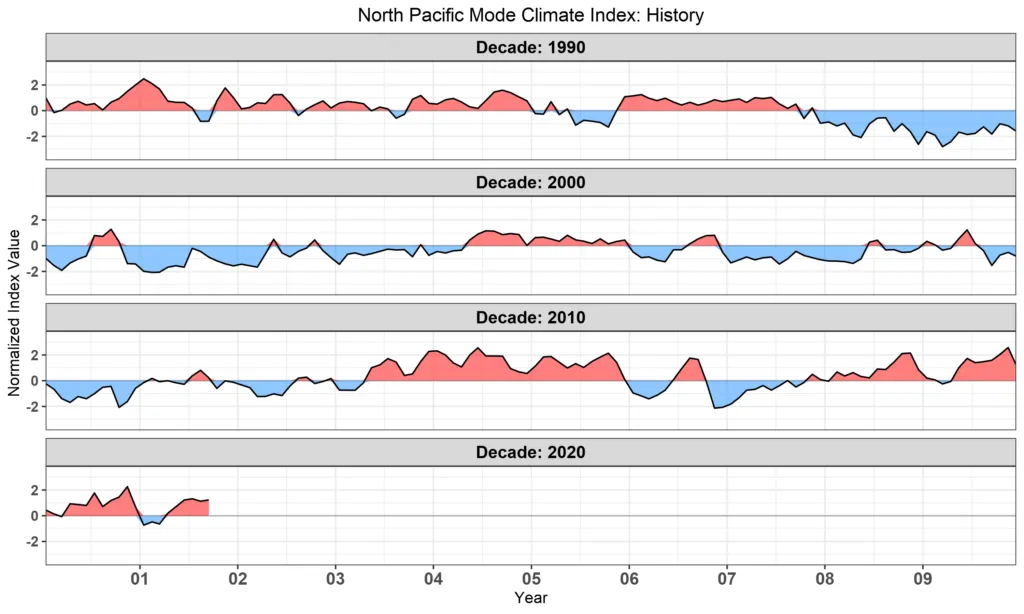
The Northeast Pacific Mode typically remains in a given phase for many months (Figure 13). That means the NPM climate index is a very useful climate index for both subseasonal and seasonal prediction.
The Northeast Pacific Mode and Corn Belt Weather
A FarmDoc blog post (October 9, 2023) suggests that the perceived slowdown in U.S. corn yield growth since 2013 may simply reflect a period of unfavorable growing season weather.
However, CropProphet’s analysis highlights an important trend: from 1980 to 2014, the production-weighted daily maximum temperature during corn pollination varied significantly year-to-year (Figure 14). Since 2014, this variability has been notably lower.
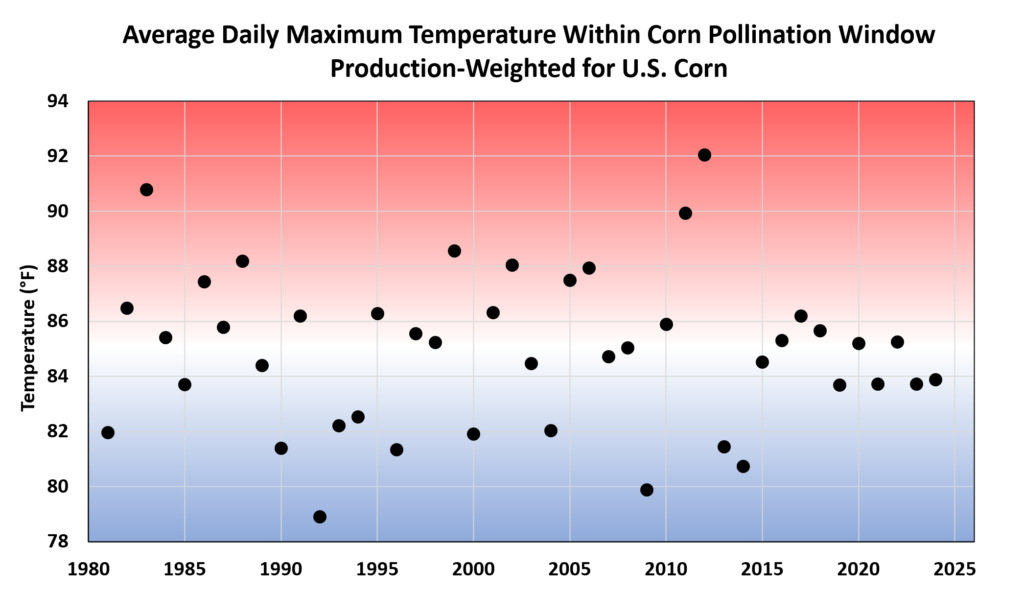
Figure 14. The annual average daily maximum temperature during the US corn pollination window since 1986.
Why Has This Happened?
The North Pacific Mode (NPM), a sea surface temperature (SST) index, cycles between positive and negative phases every one to five years (Figure 15A). A positive NPM in July leads to warmer SSTs in the Gulf of Alaska, enhancing convection and deepening the Pacific jet stream. This results in northwesterly flow into the North American Pacific Northwest and a mid-level atmospheric low over the Midwest, as shown in Figure 16.
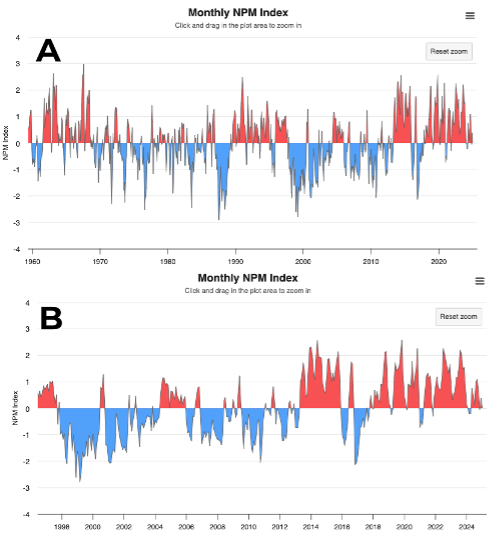
Figure 15. (A) The North Pacific Mode (NPM) SST index time series from 1980 to the start of 2025. (B) The same data but staring at 1997.
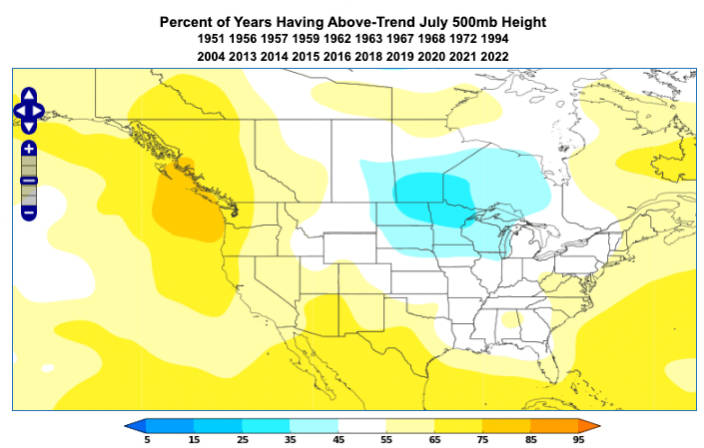
Figure 16. The average 500 mb height deviation from normal for years when the North Pacific Mode is positive.
This pattern creates a mid-atmosphere trough that enhances precipitation and brings cooler air from the Canadian plains into the Midwest. Figures 17 and 18 illustrate how positive July NPM conditions increase the probability of below-normal temperatures and above-normal precipitation, which are favorable for corn growth.
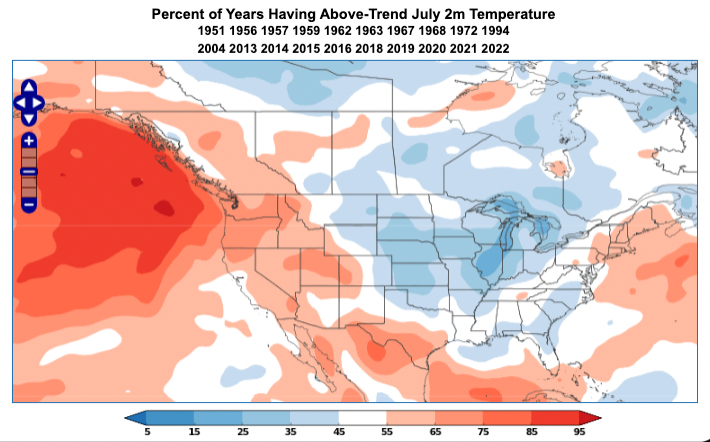
Figure 17. The probability of above normal trend corrected temperatures for years with a positive July North Pacific Mode index. The regions colored in blue indicate a greater likelihood of below normal temperatures.
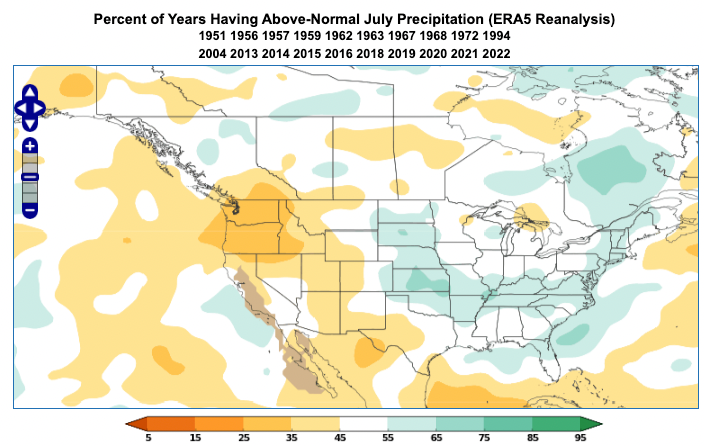
Figure 18. The probability of above normal precipitation for years with a positive July North Pacific Mode index.
Since 2013, the NPM has remained predominantly positive, contributing to a decade of stable, beneficial weather conditions during the corn pollination window. This contradicts the FarmDoc claim that recent years have seen poor growing conditions. If anything, the consistent influence of a positive NPM suggests that corn yield trends should have accelerated rather than slowed.
Concluding remarks on the Northeast Pacific Mode
The Northeast Pacific Mode is a cyclical variation of sea surface temperature anomalies over the Northeast Pacific Ocean that is distinct from the Pacific Decadal Oscillation. The phases of the NPM coincide with identifiable weather patterns over large parts of the globe across all seasons.
The Northeast Pacific Mode phases can persist for many months which makes the NPM a prime consideration in subseasonal and seasonal forecasting. Scientists believe that the NPM was a major factor in the record-breaking cold spell which struck the United States in the winter of 2013-14.