One of the top weather and climate headlines this winter has been the remarkable parade of storms that affected the southwestern U.S. in the first half of January. A sequence of “atmospheric rivers” transported prodigious volumes of water from the sub-tropical Pacific into California and the western U.S., leading to extreme rainfall and suffocating mountain snows across a region that has been suffering from severe and lengthy drought.
The extreme onslaught of precipitation has produced a dramatic improvement in California’s drought status, with mountain snowpack now far above normal, but flooding impacts have been significant at lower elevations.
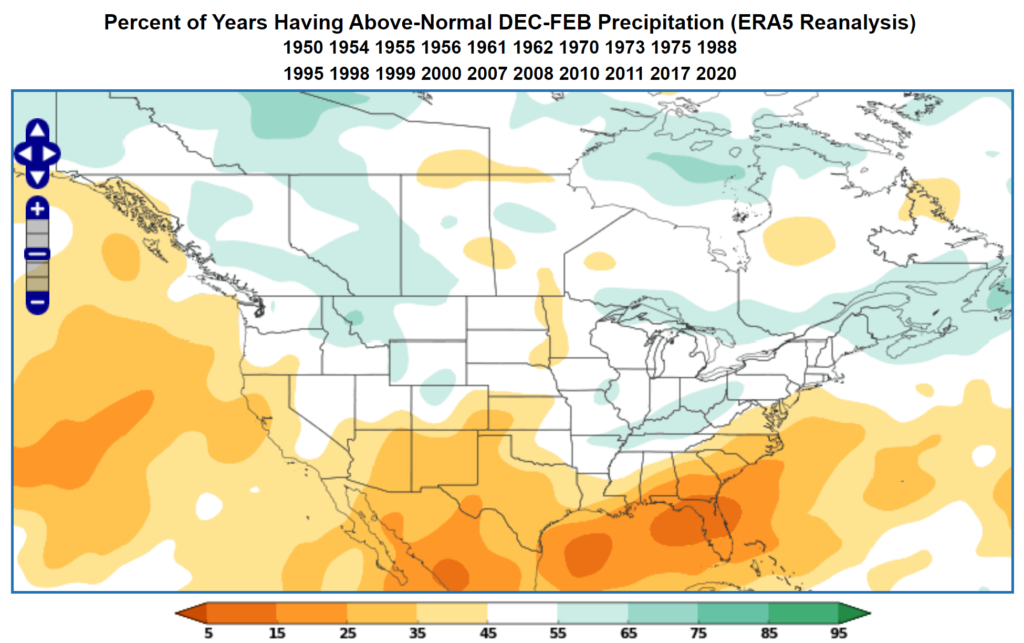
The sudden change in moisture fortunes for drought-stricken California is a surprise from the standpoint of conventional seasonal forecasts, because La Niña tends to produce dry winters in the southwestern United States. La Niña has been entrenched since summer 2020, and although its demise now appears likely in spring 2023, this winter is the third consecutive La Niña winter. The figure below (created in the WCS seasonal portal) shows the typical precipitation anomaly patterns during La Niña winters:
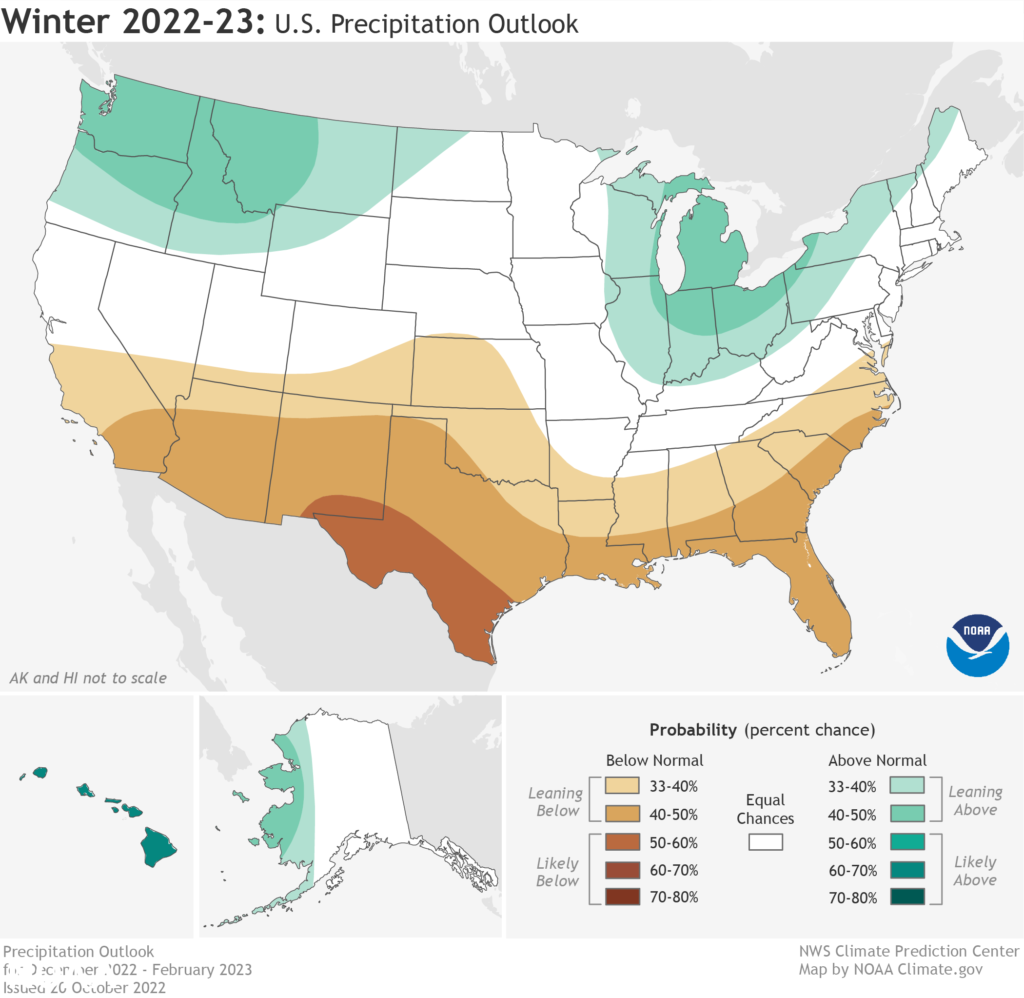
NOAA’s winter forecast, issued in October 2022, clearly showed a typical La Niña influence:
ECMWF Subseasonal Forecasts
While it may have been impossible to anticipate a wet California winter months in advance, it is interesting to consider when the first indications emerged to suggest that an unusually wet spell of weather was about to occur. And in particular, when did highly unusual or extreme rainfall become a plausible or even likely scenario?
To answer this question, we examine the subseasonal forecasts from the ECMWF model. Issued twice per week, the ECMWF extended forecast delivers predictions to 46 days and represents the state of the art in subseasonal numerical weather prediction. The standard method for examining the subseasonal forecast is to compare the average of the forecast ensemble members to the seasonal normal: for example, does the ensemble mean show above-normal, near-normal, or below-normal rainfall for a particular window of time?
In the case of California’s recent wet episode, the ensemble mean ECMWF forecasts clearly showed a signal at least two weeks ahead: the middle panel in the figure below shows the “week 3” forecast initialized on December 22.
Predicted Risk of Extreme Rainfall
Let’s take the analysis a little deeper. We are particularly interested in the predicted chance of extreme rainfall, and so it is more relevant to examine the upper tail of the rainfall forecast distribution: for example, what did the most extreme ensemble members show at a lead time of 3 or 4 weeks?
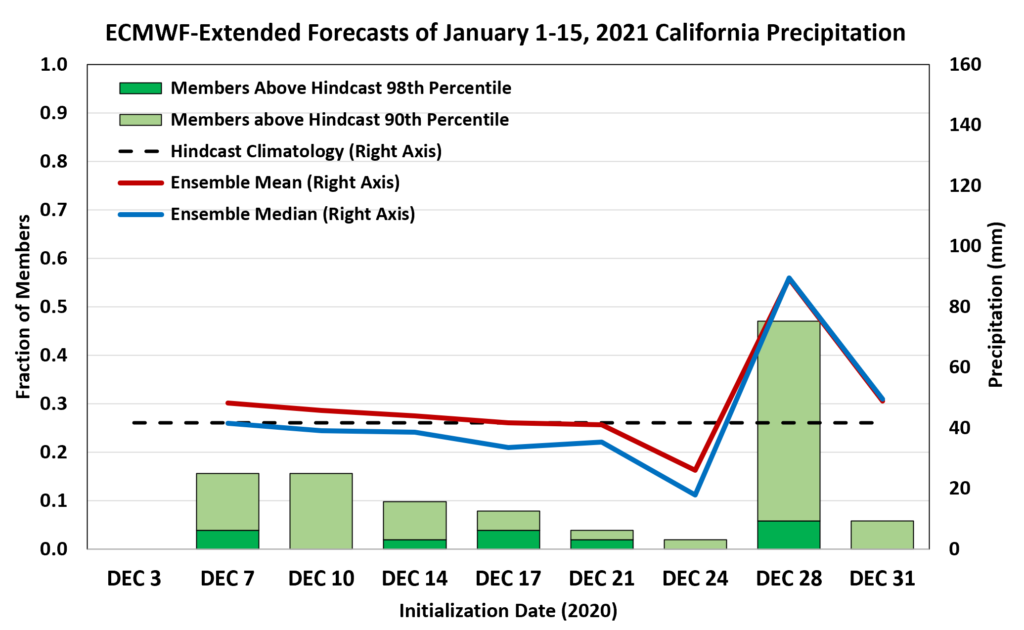
Consider the figure below. Here we’re looking at consecutive forecasts of total precipitation for the first 15 days of January, averaged over California. The red and blue lines show the evolution of the ensemble mean and median respectively, and these can be compared to the horizontal dashed line, which shows the model climate for this window of time (i.e. the normal outcome, averaged over 20 years of retrospective forecasts). Clearly the ensemble mean and median jumped well above normal on December 22, consistent with the figure above.
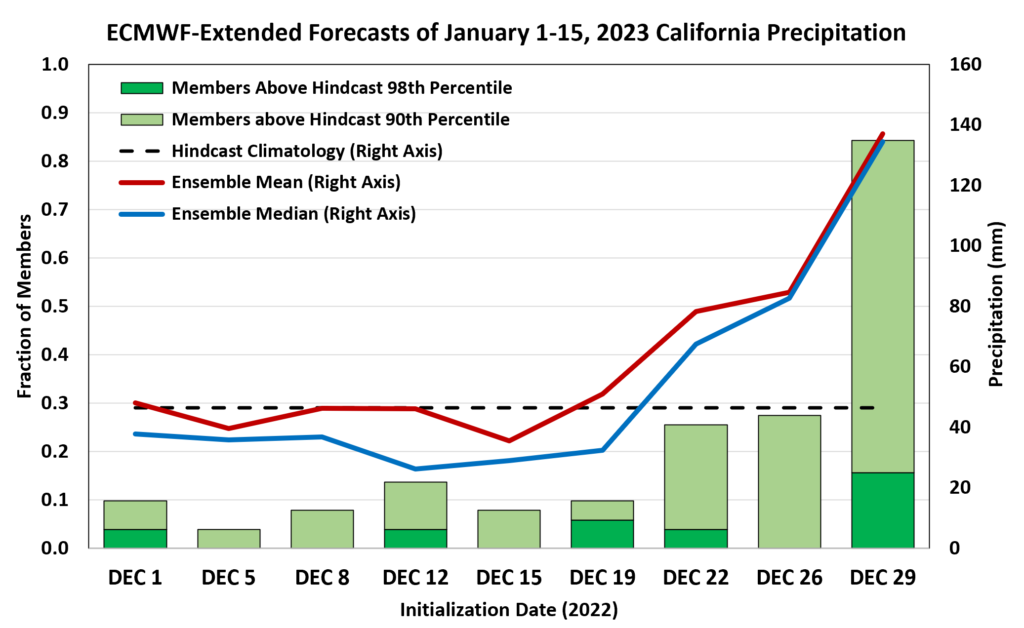
The green columns represent the fraction of the ensemble members that showed very high precipitation for California, with “very high” being defined as the 90th percentile of the hindcast distribution for the light green columns, and the 98th percentile for the dark green columns. At long lead times, when skill is marginal, we would expect about 10% of the members to exceed the 90th percentile by random chance, and about 2% would randomly exceed the 98th percentile.
We see that the number of ensemble members with a top-10% outcome jumped up on December 22, consistent with the higher ensemble mean, and by December 29 about 15% of the members showed an extreme top-2% outcome. However, there’s little sign of any meaningful signal prior to December 22, and we can conclude that the model simply did not provide any robust signs of extreme rainfall prior to that date.
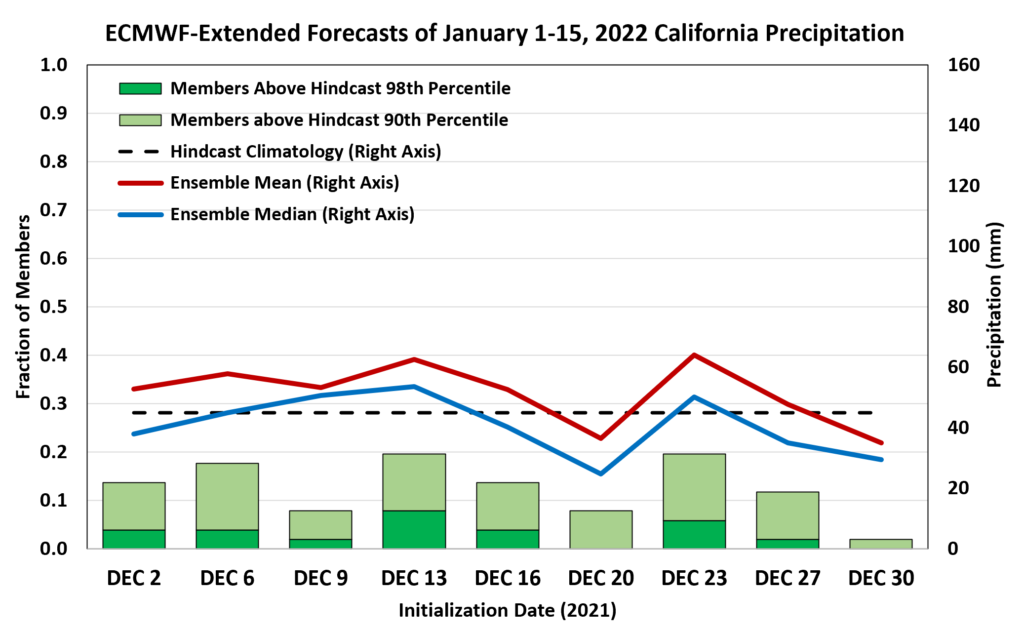
It’s interesting to compare this forecast to an identical analysis from previous years when an extreme outcome did not occur in the same date window. For example, ECMWF forecasts leading up to the first half of January 2022 actually showed a greater risk of very high precipitation until the start of the target window was less than 10 days away.
Going back another year, it’s interesting to see a rather striking “false alarm” in the forecast issued on December 28, 2020. In just this one forecast, the fraction of ensemble members with a top-10% outcome jumped up to nearly 50%, but the signal disappeared completely in the next forecast.
Conclusion
In conclusion, the ECMWF subseasonal forecasts began to show significantly above-normal January 1-15 California precipitation beginning with the December 22 forecast, but there’s no evidence of a meaningful signal at greater lead times. The 2020 example shows that major false alarms can occur even at relatively short lead times, and so caution is needed when interpreting the model signals.
More precisely, a quantitative approach to interpreting the model data is critical: how can we know when the shift in the ensemble distribution is meaningful? Is it possible to translate the model signals into robust and reliable probability forecasts of extreme events? The World Climate Service is actively developing techniques and solutions to answer these questions and produce forecasts tailored to predicting the risks of extremes.