When you live on a rock in the Atlantic Ocean, windy and rainy weather is common. Rain is seemingly always in the forecast for residents of the United Kingdom, which is particularly true in winter. However in December 2013 the British weather was strangely super-charged and stormy weather pummelled the islands from the start of the month to end of the month. The culprit causing this particularly disruptive weather in December 2013 is known as the Quasi-Biennial Oscillation.
The Quasi-Biennial Oscillation (often referred to as the QBO) is a stratospheric phenomenon that strongly impacts global weather on Earth’s surface, and is therefore an important consideration in long-range weather prediction.
The Quasi-Biennial Oscillation: Discovery
The stratosphere is the layer of the atmosphere 7-30 miles (12-48km) above the surface of the Earth (Figure 1). It lies above the troposphere, the lowest layer which contains virtually all of the atmospheric water vapor as well as the weather we experience each day. The stratospheric air may be clear and not very dense, but it occasionally has a surprisingly strong winter weather impact at many places.
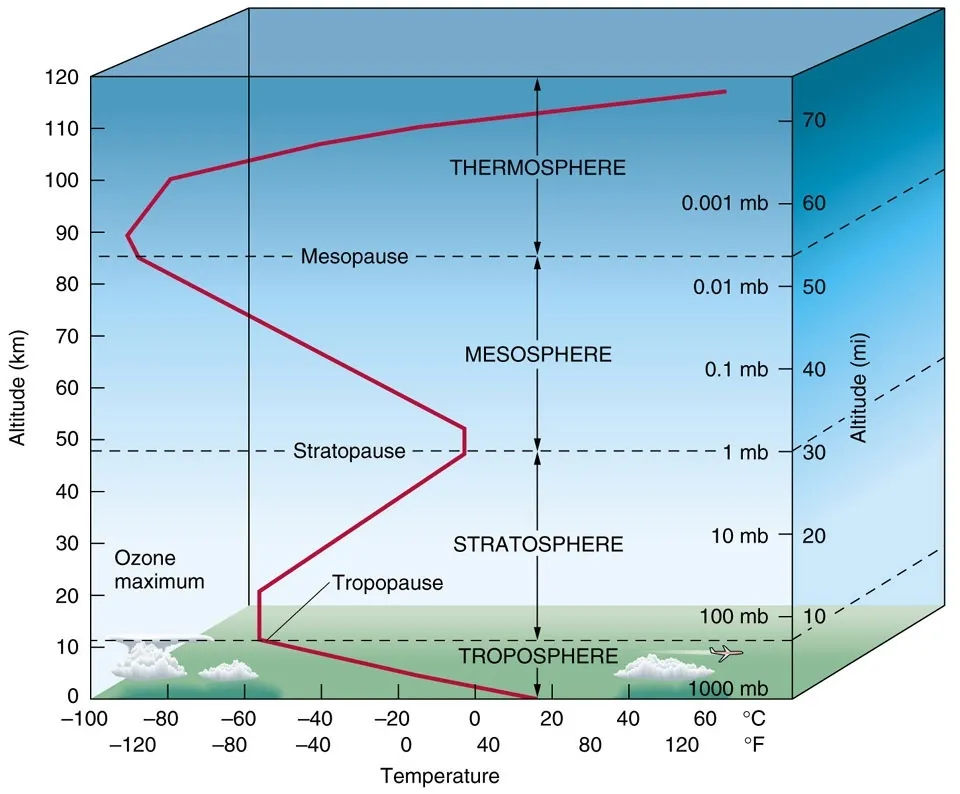
Fig. 1: A cross section through the atmosphere. Credit UCSD. Note mb (millibars) = hPa (hectoPascals)
Following the 1883 eruption of Krakatoa, easterly winds were observed above the tropics at an altitude of 15 to 20 miles. A quarter of a century later, weather balloons released over Central Africa revealed westerly winds in the lower stratosphere which was counter to the conventional wisdom of the day. Researchers at the time were puzzled by the apparent contradiction in their data.
In the 1950s researchers at the UK’s Meteorological Office finally solved the puzzle. It turned out that lower stratospheric winds above the tropics oscillated between easterly and westerly with a fairly regular 28 to 29 month cycle. The Quasi-Biennial Oscillation was discovered!
The question as to how and why the QBO existed was to puzzle scientists throughout the second half of the 20th century. Eventually it was determined that atmospheric waves, known as gravity waves, propagate vertically causing the stratospheric winds to oscillate. The result today is that the QBO is now successfully simulated in the world’s leading climate models and we can incorporate its impacts in our long-range forecasts.
The Quasi-Biennial Oscillation: History
Since 1953 the Free University of Berlin has been maintaining an observational record of the QBO. The switch between easterly and westerly wind direction occurs high in the stratosphere at 10 hPa and then propagates downwards through the stratosphere over time creating the characteristic slanting appearance in the chart (Figure 2).
For the most part this oscillation between easterly and westerly has been remarkably reliable: with a consistent rate of change above 30hPa. Below 30hPa the onset of westerly winds slows, but it usually reaches the lower stratosphere (100 hPa). In early 2016 scientists were shocked when the descending westerly failed to develop for the first time in recorded history. The usual cycle has more or less recovered since, and thus the QBO can be predicted with confidence several months ahead once again.
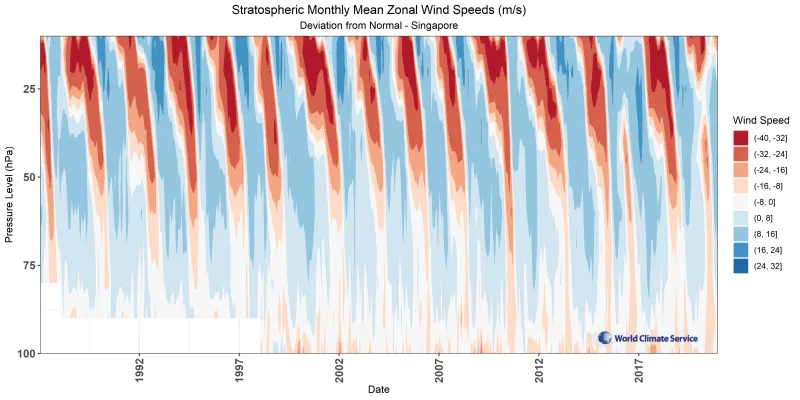
Fig. 2: A history of the QBO in the stratosphere above Singapore (data provided by the Free University of Berlin). The blue shade shows westerlies and the red shading shows easterlies in m/s.
The Quasi-Biennial Oscillation: Long Range Forecasting
The QBO is conventionally classified based on wind speeds and direction at 30 hPa. This means that it is relatively easy to predict in which phase the QBO will be in the coming several months. We only need to examine wind speeds higher in the stratosphere to see what lies ahead. In late 2021 the QBO is in the easterly (negative) phase.
It is not clear how the QBO influences weather at the surface, but when we sort the climatology of weather variables by QBO phase, we find that the QBO has some influence over the global weather patterns. This makes the QBO a valuable component of long range weather forecasting.
The World Climate Service has developed a powerful data mining system that enables users to quickly explore the impact of the Quasi-Biennial Oscillation, and many other indices, by phase for each month of the year, showing impacts on all the major weather variables all around the globe. The maps featured in this article can be produced in just a few clicks of the mouse.
The Quasi-Biennial Oscillation: Westerly Phase Impacts
North America in Winter
During the westerly (positive) phase of the QBO (often denoted WQBO) in the Northern Hemisphere wintertime, much of the Northern US is more likely to be cooler than normal (Figure 3).
At the same time, the Upper Midwest, the Northern Rockies and California are usually wetter than normal, while the South and East are more likely to be drier than normal (Figure 4).
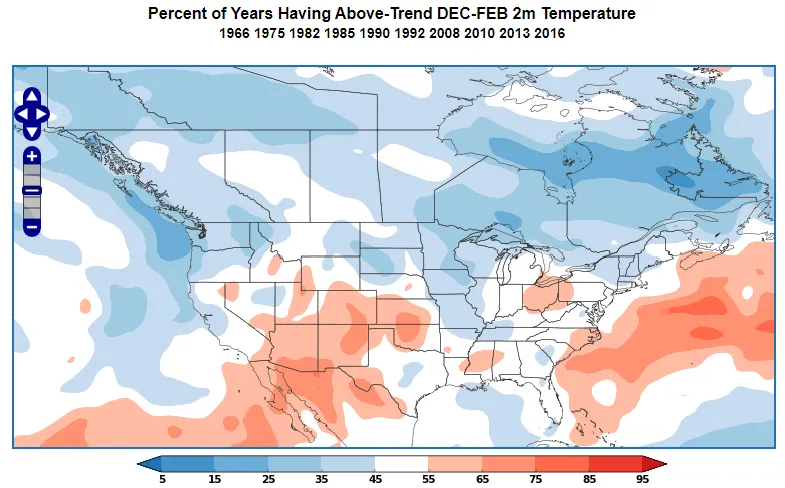
Fig. 3: World Climate Service temperature anomaly probability map for a westerly Quasi-Biennial Oscillation in winter
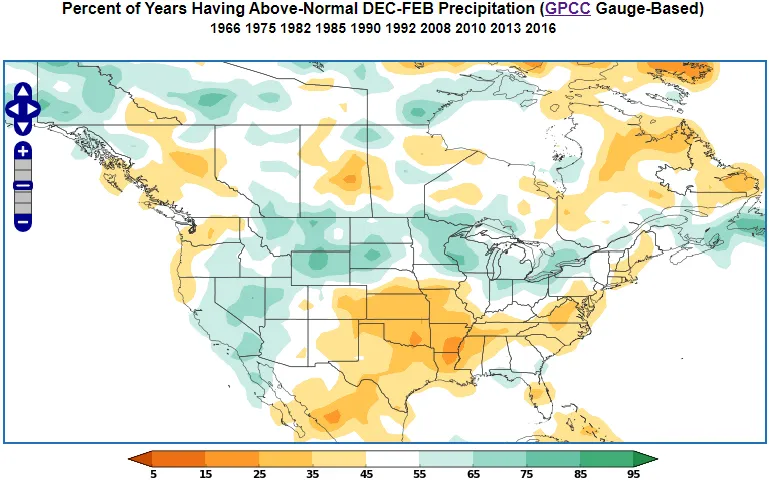
Fig. 4: World Climate Service rainfall anomaly probability map for a westerly Quasi-Biennial Oscillation in win
Europe and Asia in Winter
During the WQBO in the Northern Hemisphere wintertime, Europe and Asia are generally warmer than normal (Figure 5), but there are areas of cooler than normal weather over China and much of Southern Europe.
At the same time, there is a tendency for wetter than normal winters over Eastern Europe, Russia and Southwest China. Meanwhile the WQBO brings dry winters to Southern Europe, Finland and the Middle East (Figure 6).
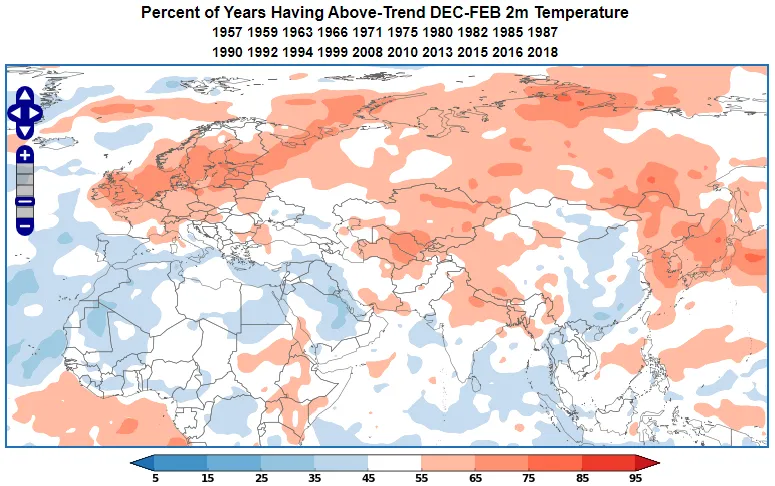
Fig. 5: World Climate Service temperature anomaly probability map for a westerly Quasi-Biennial Oscillation in winter
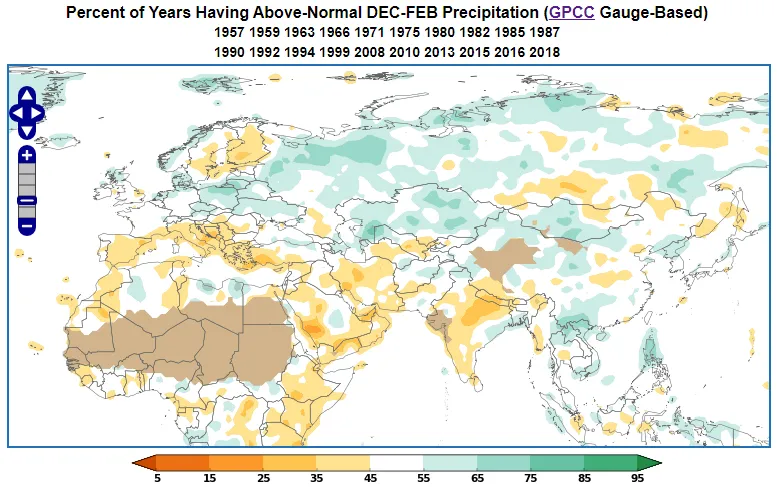
Fig. 6: World Climate Service rainfall anomaly probability map for a westerly Quasi-Biennial Oscillation in winter
The Quasi-Biennial Oscillation: Westerly Phase Impacts
North America in summer
During the westerly (positive) phase of the QBO in the Northern Hemisphere summer, temperatures over CONUS do not show a strong tendency. There is a small preference for cooler than normal weather over the Plains, and we also see a slight bias towards warmer than normal on the West Coast and the Mid-Atlantic (Figure 7).
Summer rainfall is significantly impacted by the QBO in some states. California, the Northern Rockies and Louisiana tend to be drier than normal. At the same time an area from Ohio to Florida tends to be wetter than normal (Figure 8).
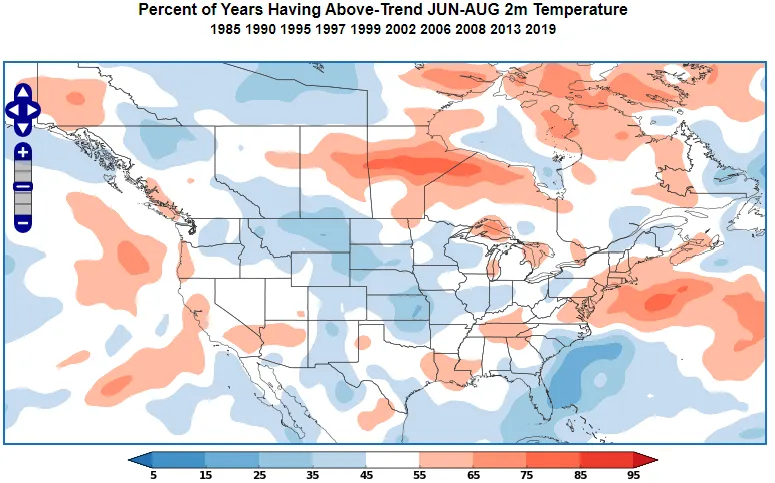
Fig. 7: World Climate Service temperature anomaly probability map for a westerly Quasi-Biennial Oscillation in summer
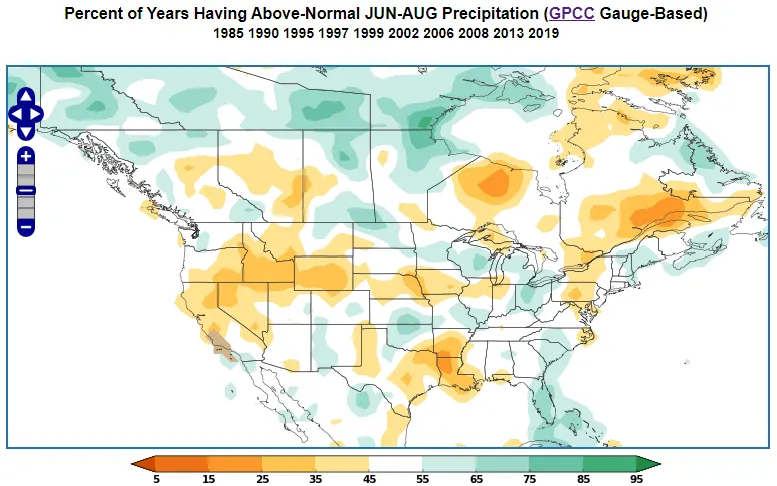
Fig. 8: World Climate Service rainfall anomaly probability map for a westerly Quasi-Biennial Oscillation in summer
The Quasi-Biennial Oscillation: Easterly Phase Impacts
North America in winter
During the easterly (negative) phase of the QBO (often denoted EQBO) in the Northern Hemisphere wintertime, much of CONUS is likely to be cooler than normal, particularly Texas. At the same time places West of the Rockies are more likely to be warmer than normal (Figure 9).
The EQBO also strongly influences rainfall distribution over the lower 48 states. The Rockies, the West, the Ohio Valley and the Northeast are all more likely to be drier than normal, while the Southern Plains and parts of the Deep South are usually wetter than normal (Figure 10).
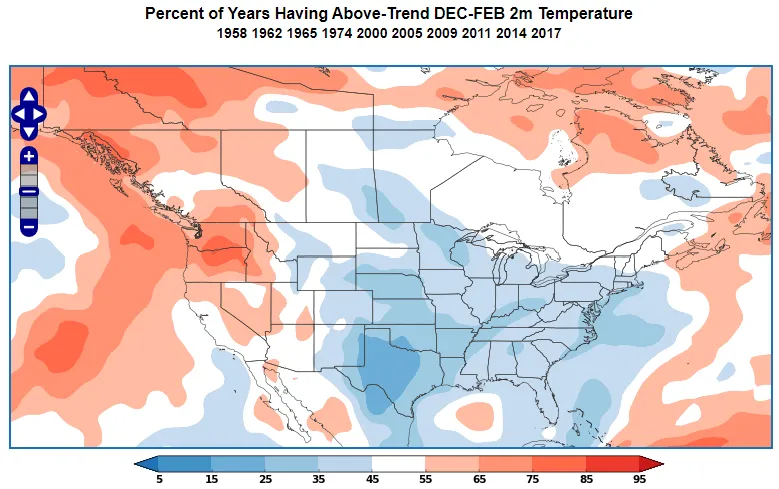
Fig. 9: World Climate Service temperature anomaly probability map for an easterly Quasi-Biennial Oscillation in winter
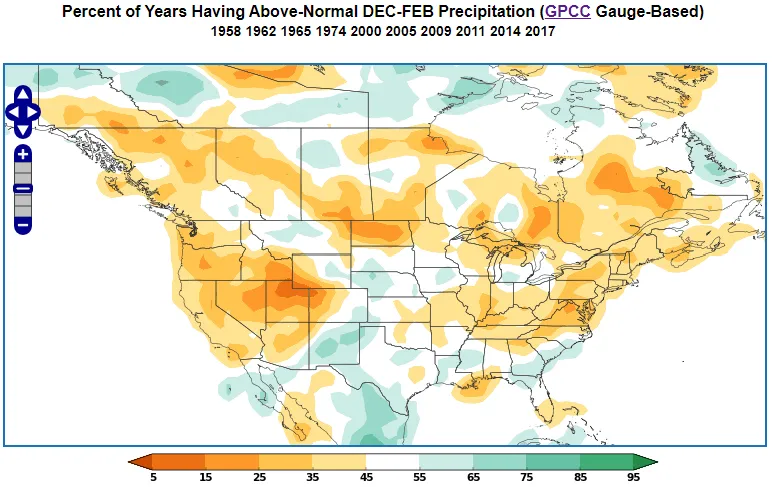
Fig. 10: World Climate Service rainfall anomaly probability map for an easterly Quasi-Biennial Oscillation in winter
The Quasi-Biennial Oscillation: Easterly Phase Impacts
North America in summer
During the easterly (negative) phase of the QBO in the Northern Hemisphere summer, temperatures over CONUS are usually warmer than normal for the Rockies, the Plains and parts of the Midwest. There is a preference for cooler than normal weather over much of the Southeast (Figure 11).
Summer rainfall is significantly impacted by the QBO with the Pacific Northwest, the Rockies, the Plains and much of the Midwest usually being drier than normal. At the same time the East and the Deep South tends to be wetter than normal (Figure 12).
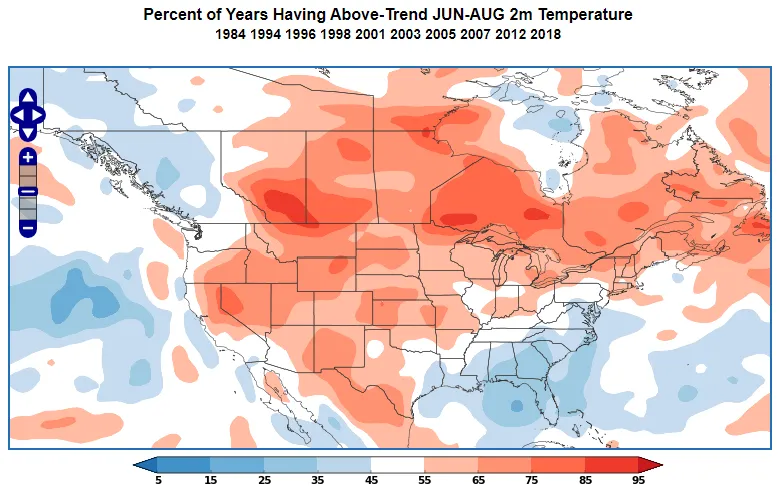
Fig. 11: World Climate Service temperature anomaly probability map for an easterly Quasi-Biennial Oscillation in summer
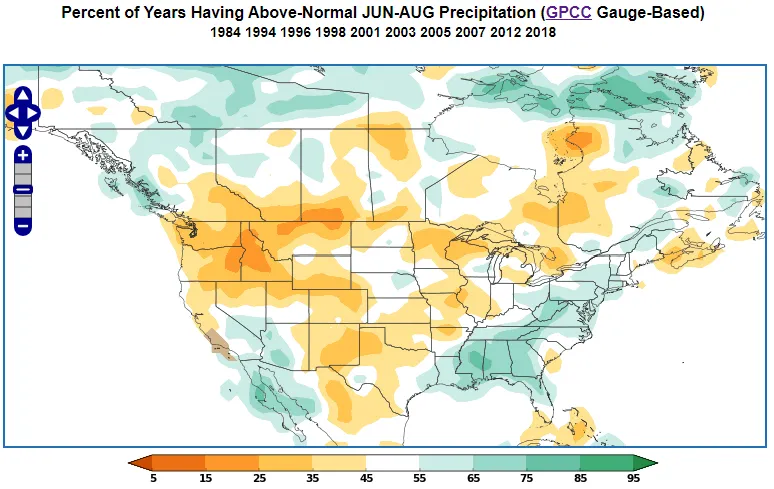
Fig. 12: World Climate Service rainfall anomaly probability map for an easterly Quasi-Biennial Oscillation in summer
Europe and Asia in Summer
During the easterly (negative) phase of the QBO in the Northern Hemisphere summer, temperatures over Europe and Asia are likely to be cooler than normal. Only Finland, Siberia, Turkey and parts of China are usually warmer than normal (Figure 13).
Summer rainfall is generally above normal over Eastern Europe and China. Rainfall is likely to be below normal for much of Western Europe, Southern Russia and Japan (Figure 14).
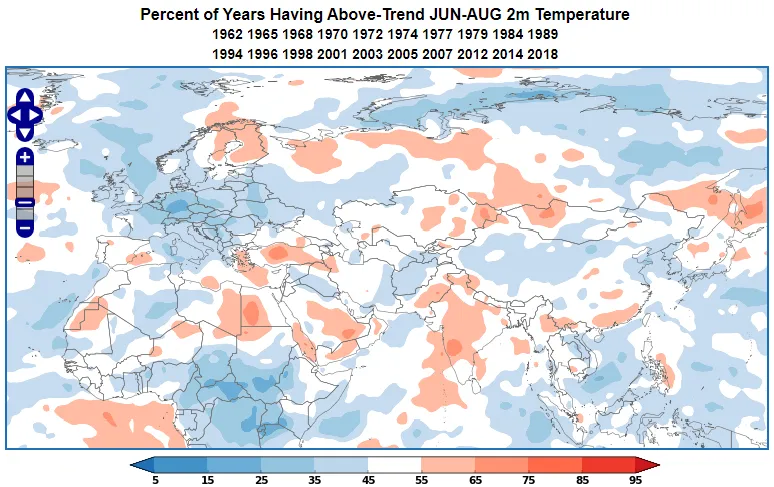
Fig. 13: World Climate Service temperature anomaly probability map for an easterly Quasi-Biennial Oscillation in summer
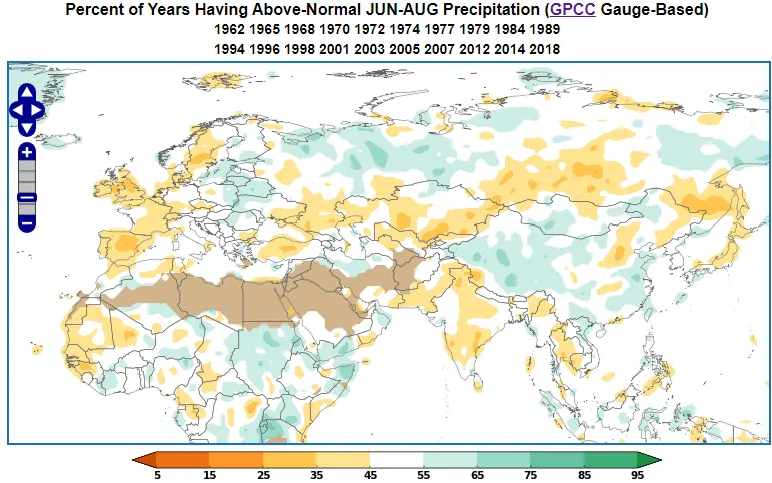
Fig. 14: World Climate Service rainfall anomaly probability map for an easterly Quasi-Biennial Oscillation in summer. Note: within the dark shaded areas annual rainfall is too low to be useful
Concluding Remarks about the Quasi-Biennial Oscillation
The Quasi-Biennial Oscillation is a cyclical variation of wind direction in the lower stratosphere that can influence weather patterns across large parts of the globe.
For nearly 70 years the Quasi-Biennial Oscillation has usually been switching between phases at a reliable and steady rate. As these changes are predictable and phases persist for many months at a time, the QBO has become a primary and valuable consideration in seasonal forecasting.
It is unusual for the QBO to be held responsible for a single weather event, but when the United Kingdom experienced the stormiest December in 44 years, the UK Met Office was able to quickly identify the cause.