The Arctic Oscillation plays a vital role in driving the climate of the northern mid-latitudes. In this article we explain why the tracking the Arctic Oscillation climate index is particularly useful in long-range forecasting.
What is the AO Index?
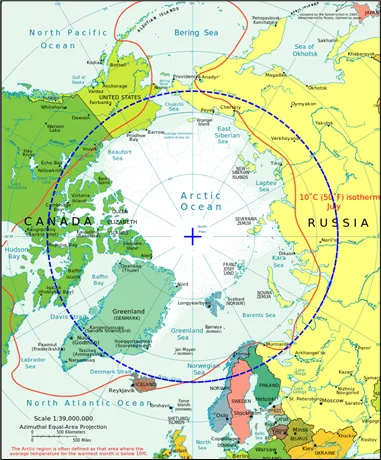
The Arctic Oscillation (AO), also known as the AO index, is one of Earth’s most important atmospheric climate cycles. It occurs over the Arctic and influences mid-latitude weather patterns over the entire Northern Hemisphere. It is primarily tracked using the AO Index (AOI), a metric that quantifies the rate at which polar air penetrates the mid-latitudes. This climate phenomenon manifests as a “ring-like” anomaly in sea-level pressure or geopotential fields, characterized by atmospheric pressure conditions in the Arctic (20°–90° N) that are opposite to those found in the mid-latitude band of 37°–45° N.
Technically, the AO’s loading pattern is identified as the leading mode of an empirical orthogonal function (EOF) analysis applied to a long history of sea-level pressure data. The AO index time series is simply the projection of these pressure anomalies onto the loading pattern, standardized with respect to a specific historical base period. The current value of the AO index is determined by applying the loading pattern to current sea-level pressure data. On average, there is low pressure centered over the North Pole. This tropospheric vortex tends to be stronger in winter than it is in summer, and thus the influence of the Arctic Oscillation is greater in winter than it is in summer.

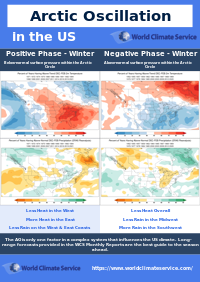
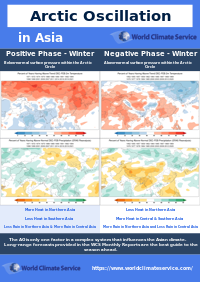
The AO phase is a major driver of winter weather variability, as discussed below. Negative AO index values are particularly important. During a negative phase, the polar vortex and upper-level westerly winds tend to weaken, allowing cold Arctic air to spill southward into the United States, Northern Europe, and Asia.
Conversely, a positive phase is associated with the opposite conditions, typically trapping cold air near the pole, allowing the mid-latitudes to remain relatively mild during winter. The arctic oscillation is a dominant driver of Northern hemisphere winter climate variables and is not as important during the summer. The Southern Hemisphere equivalent is called the Antarctic Oscillation (AAO) and is also called the Southern annular mode.
Defining the AO Index has become more challenging as the Earth’s mean climate state changes, meaning that the choice of base period can shift the index and alter the apparent strength of its teleconnections. Nevertheless, the AO index remains a critical tool for long-range forecasters to assess the likelihood of specific conditions.
The AO is defined by the departure from normal of the surface pressure within the Arctic Circle (usually north of 20N). Check out and click on the Arctic Oscillation (AO) quick summary PDFs for the:
What is the Current Value of the AO Index?
The current value of the AO is displayed in Figure 2.
What is the Arctic Oscillation – Positive Phase
When pressure north of the Arctic Circle is lower than normal, the Arctic Oscillation is said to be positive. A positive AO leads to a stronger and straighter polar jet. The more positive the AO index, the stronger and straighter the jet (left image Figure 3).
A strong polar jet driven by lower pressure over the Arctic has repercussions for much of the mid-latitudes. The polar jet maintains a stable, northerly position and tends to keep the cold Arctic air inside the Arctic. This means that much of the mid-latitudes are warmer than normal owing to the absence of cold air masses diverting to southerly latitudes.
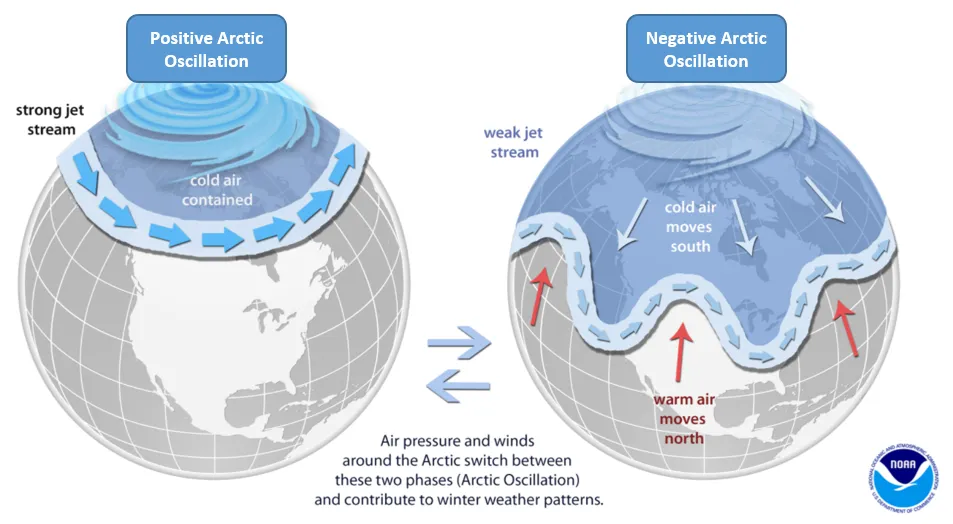
Figure 3. A schematic diagram showing the characteristics of the polar jet during the positive and negative phases of the North Atlantic Oscillation.
The World Climate Service has developed a powerful data mining system that enables users to quickly explore the impact of the Arctic Oscillation, and many other indices, by phase for each month of the year, showing impacts on all the major weather variables all around the globe. The maps featured in this article can be produced in just a few clicks of the mouse.

Figure 4. World Climate Service depiction of the average surface pressure anomaly for a strongly positive Arctic Oscillation in winter.
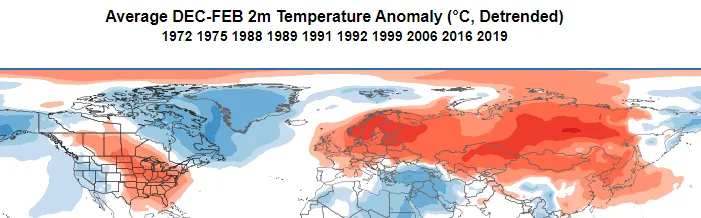
Figure 5. Average temperature anomaly for a strongly positive Arctic Oscillation in winter, as shown in Figure 4.
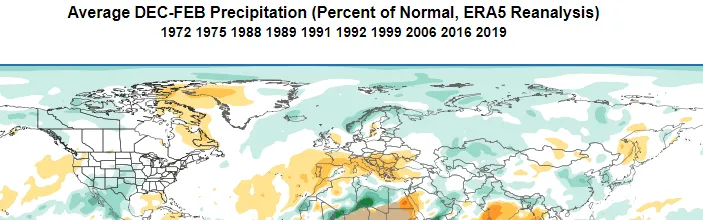
Figure 6. World Climate Service depiction of average rainfall anomalies during a strongly positive AO in winter.
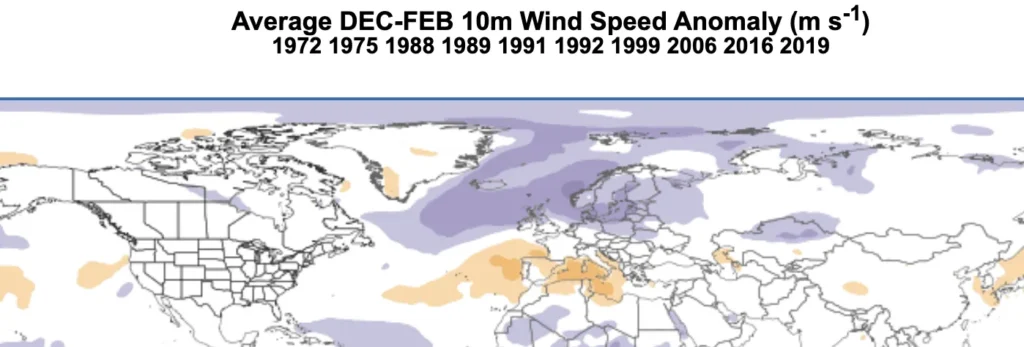
Figure 7. World Climate Service depiction of average 10m wind speed anomalies during a strongly positive Arctic Oscillation in winter.
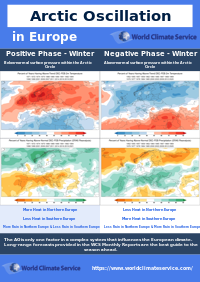
Europe is typically anomalously wet and windy in the north, and dry and calm in the south. Meanwhile, the Central US is usually wetter than normal.
What is the Arctic Oscillation – Negative Phase
Conversely, when pressure north of the Arctic Circle is higher than normal, the Arctic Oscillation is deemed to be negative. A negative AO leads to a weaker, buckled polar jet (right image Figure 3). The more negative the AO climate index, the stronger the distortion of the polar jet.
A weak polar jet caused by higher pressure over the Arctic also influences the weather across the mid-latitudes. As the polar jet is weak, it tends to meander and often extends meridionally far to the north and south. Cold air is able to leak out of the Arctic occasionally. Thus, we find that much of the mid-latitudes experience colder than normal weather during a negative AO.
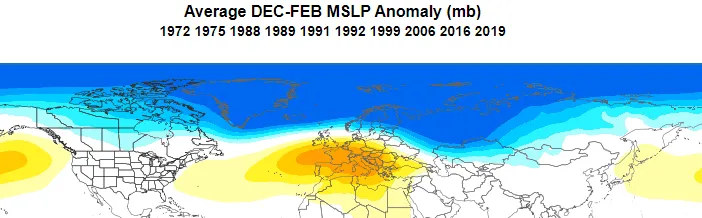
Figure 8. World Climate Service depiction of average surface pressure anomaly for a strongly negative Arctic Oscillation in winter.
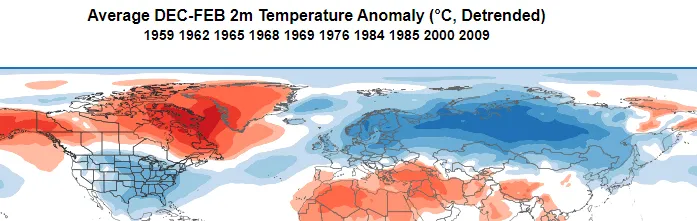
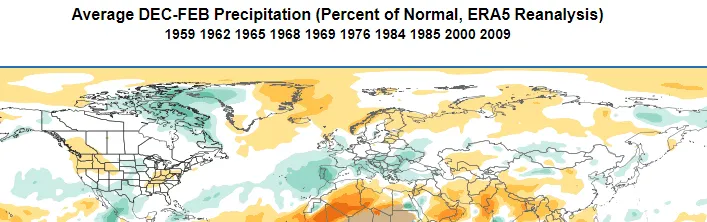
Figure 10. World Climate Service illustration of average rainfall anomalies during a strongly negative Arctic Oscillation in winter.
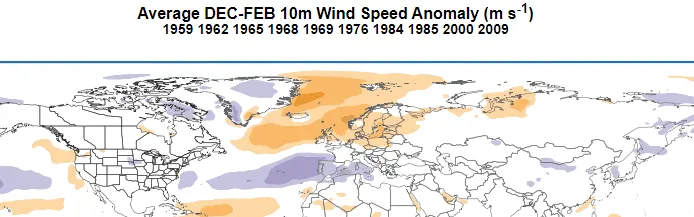
Figure 11. World Climate Service depiction of average 10m wind speed anomalies during a strongly negative Arctic Oscillation in winter.
Europe is typically anomalously wet and windy in the south, and dry and calm in the north. Meanwhile, the Central US is usually wetter than normal, which might be unexpected as it is similar to a positive AO.
What is the Arctic Oscillation – Long-Range Forecasting
The Arctic Oscillation typically remains in a given phase from a few days to a few months, and is usually unpredictable beyond 14 days ahead. In winter, however, a strong positive or negative phase tends to persist for many weeks and can sometimes be predicted with lead times of 2 to 3 weeks. The recent history of the AO is shown in Figure 12.
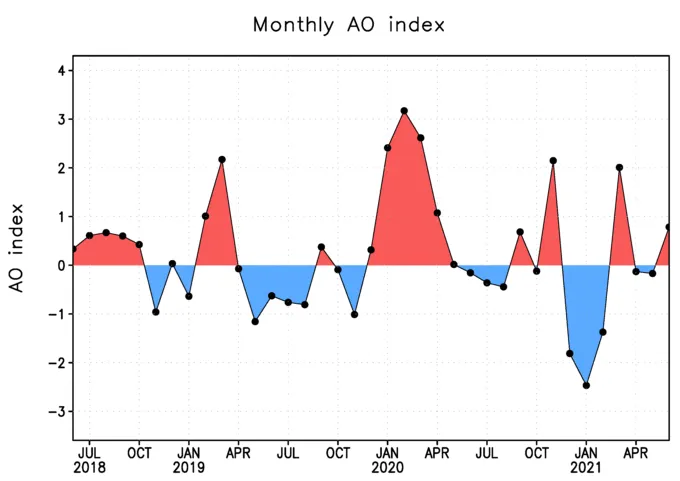
Figure 12. Chart showing the variation of the Arctic Oscillation since 2018.
The AO climate index correlates to temperature and rainfall patterns in the mid-latitudes in winter, making it a key indicator for long-range forecasting. Figure 12 shows a subseasonal forecast of the Arctic Oscillation from the ECMWF. There is a weak signal for a negative phase to develop in the first week of October.
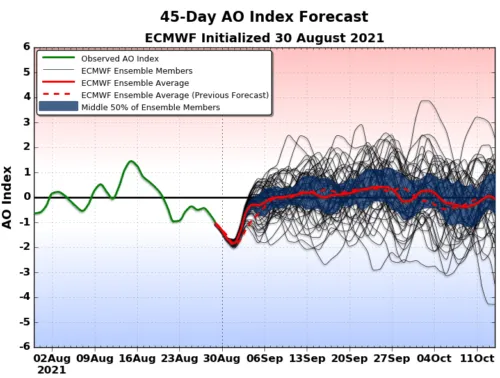
Figure 13. Example of a calibrated Arctic Oscillation forecast from the World Climate Service.
The Arctic Oscillation and Stratospheric Polar Vortex Relationship
High above the tropospheric polar vortex, a vortex also forms in the thin stratospheric air each winter. The Stratospheric Polar Vortex (SPV) develops in the fall and dissipates in the spring. It otherwise behaves similarly to the tropospheric vortex because it rotates counterclockwise when looking down on the north pole. The SPV is important because it can influence the Arctic Oscillation below.
When the SPV is stronger than normal, it tends to support a positive Arctic Oscillation. The reverse is also true; a weaker than normal SPV is more likely to coincide with a negative AO. Around every two years, the SPV temporarily collapses in a process known as sudden stratospheric warming. The AO often shifts more negative for anywhere between a few weeks to a few months when this happens.
What is the Arctic Oscillation – Conclusion
The Arctic Oscillation is a measure of the relative strength of low pressure over the Arctic and is very important as it drives the strength of the polar jet, which in turn drives the weather across mid-latitudes. The AO often impacts the phase of the North Atlantic Oscillation.
The arctic oscillation can persist in a given phase for weeks or even months in winter and can also be modified by the Stratospheric Polar Vortex – making it a key factor in long-range weather forecasting. Read more about Arctic surface temperatures.