Weather regime forecasts have been added to the World Climate Service (WCS). Weather regimes are a new long-range forecasting capability that helps energy meteorologists interpret subseasonal and medium-range model guidance through the lens of recurring, physically meaningful pre-defined circulation patterns.
Weather regimes describe the typical large-scale mid-tropospheric (500 mb) flow configurations. Machine learning classifies daily 500 mb heights over North America and Europe into a small number of well-defined patterns. The weather forecast model 500 mb height forecast data (ECMWF, AIFS, GEFS, etc) are then projected onto those patterns to determine how similar their ensemble forecasts are to each regime. Doing so makes it easier to identify the likely impacts on energy systems over the coming weeks.
Our methodology draws substantially from the word of Lee (2023), which introduced a new year-round regime classification for North America that underpins this new WCS capability. We’ve extended the methodology to the European domain.
What are Weather Regimes?
Weather regimes are recurring large-scale mid-latitude atmospheric patterns describing typical mid-tropospheric (500 mb) flow configurations over a region. Determining typical flow configurations helps to determine the surface weather conditions occurring underneath.
Each weather regime represents a distinct, physically meaningful circulation state, including ridges, troughs, and blocking patterns. These patterns can persist for several days and even weeks, providing predictability out to subseasonal timeframes.
Analyzing forecasted weather regimes simplifies extended medium-range and subseasonal scale forecasting by reducing the complexity of diagnosing the ensemble information that typical weather forecast models produce.
This approach simplifies complex ensemble forecasts into clear, pattern-based insights. By recognizing which regime is dominant and when a regime transition may occur energy meteorologists improve weather-based trading win rates by better anticipating broad weather impacts on power demand, renewable generation, and market volatility.
In short, weather regimes translate atmospheric chaos into interpretable, actionable signals for decision-making in weather-sensitive industries.
Why Weather Regimes Matter to Energy Meteorologists
Power and natural gas traders often base their view of future weather conditions on the answer to the question “will the map be red or blue?“ This refers to whether temperatures, wind speeds, and/or solar radiation will be above or below normal. Traders digest an incredible amount of information daily and seek to simplify context in their decision-making. This question helps them do that.
Weather regime forecasts allow energy meteorologists to clearly and succinctly communicate the likelihood of significant and sometimes persistent weather patterns that drive trading profitability. The weather regime analysis bridges the gap between the detailed weather forecast information models provide but with decreasing skill at long-lead times and the answer to the question, “What’s impact on power and gas markets does the long-range forecast suggest?”
Understanding what regime will prevail two or more weeks from today allows meteorologists to communicate to their traders the likely surface weather conditions across the US and Europe. For example, a Greenland High often drives colder air into the U.S. East and suppresses wind generation in ERCOT, while a Positive NAO brings milder, windier weather to Northern Europe.
Recognizing regime transitions is equally essential because regime changes herald changes in the weather. Identifying regime changes helps power and gas traders anticipate changes in demand, renewable generation, and price volatility before they appear in temperature or load forecasts.
Recent research confirms these linkages. Studies such as Bloomfield et al. (2023), Van der Wiel et al. (2017), and Grams et al. (2017) show that regimes strongly influence renewable generation variability across Europe.
How the WCS Weather Regime Forecast Works
The WCS Regime Forecast tool visualizes the daily ensemble probabilities of the major regimes identified in each forecast model, as shown in Figure 1.
ECMWF Weather Regime Forecast – An Example
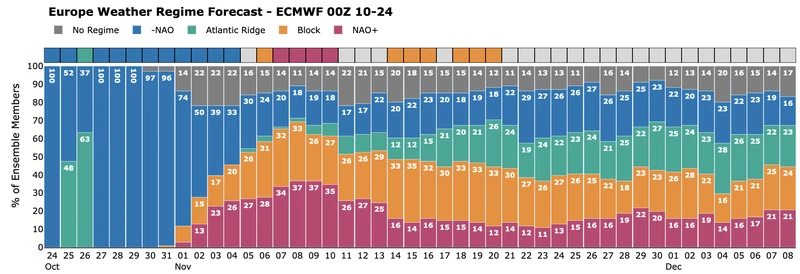
Figure 1. The ECMWF Extended probability prediction over time of the four European weather regimes.
Users examine the regime prediction for two different lead timeframes:
- medium-range (up to 15 days), from the following weather forecast models:
- ECMWF IFS
- ECMWF AIFS
- NOAA GEFS
- Canadian Modeling Centre (CMC) GEM
- A blend of all ensemble members from each model
- subseasonal (up to 46 days), from the following subseasonal forecast models:
- ECMWF Extended
- NOAA GEFS
- CMC GEM
The forecasts provide a probabilistic determination of the likelihood of four location-dependent regimes.
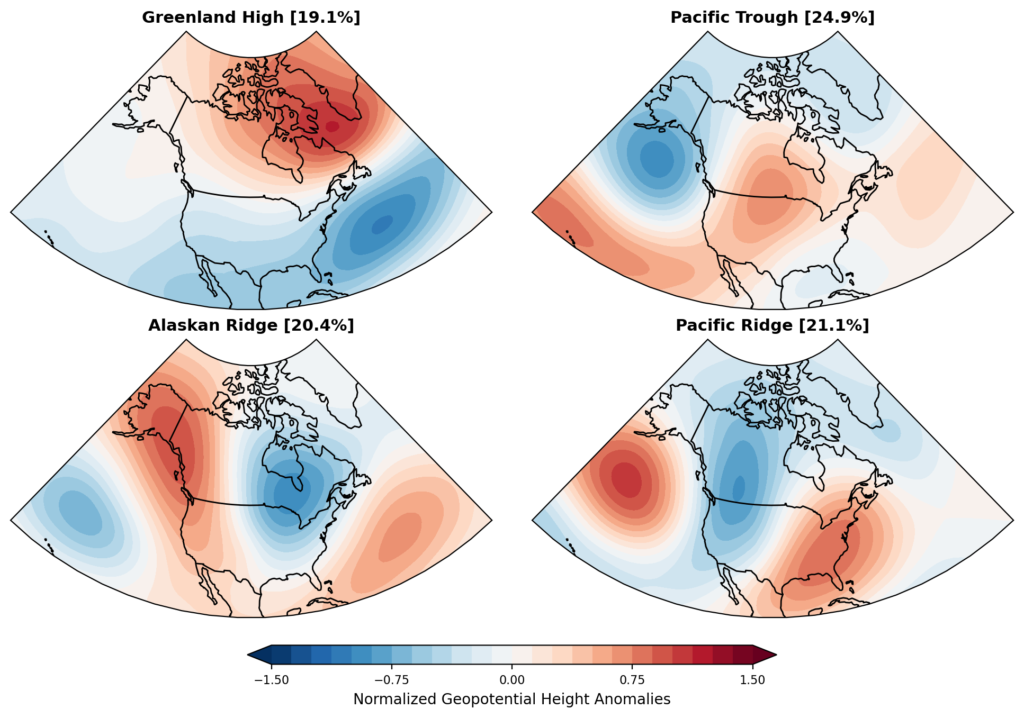
North America uses a year-round regime classification (Figure 2)
- Alaskan Ridge,
- Greenland High,
- Pacific Ridge, and
- Pacific Trough.
Figure 2. North America Regimes.
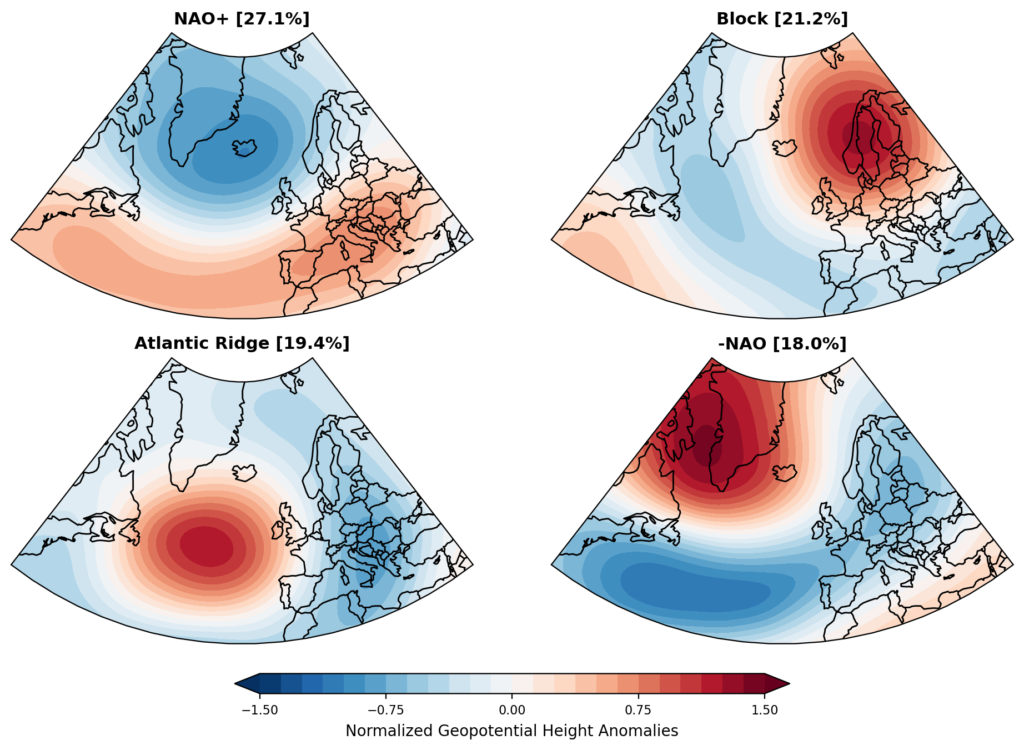
Europe uses distinct winter (October–March) and summer (April–September) regime sets, reflecting seasonal jet-stream differences (Figure 3). The regimes are:
- Positive NAO (NAO+)
- Negative NAO (NAO-)
- Atlantic Ridge
- Block
(a) Europe Regimes in Winter
(b) Europe Regimes in Summer
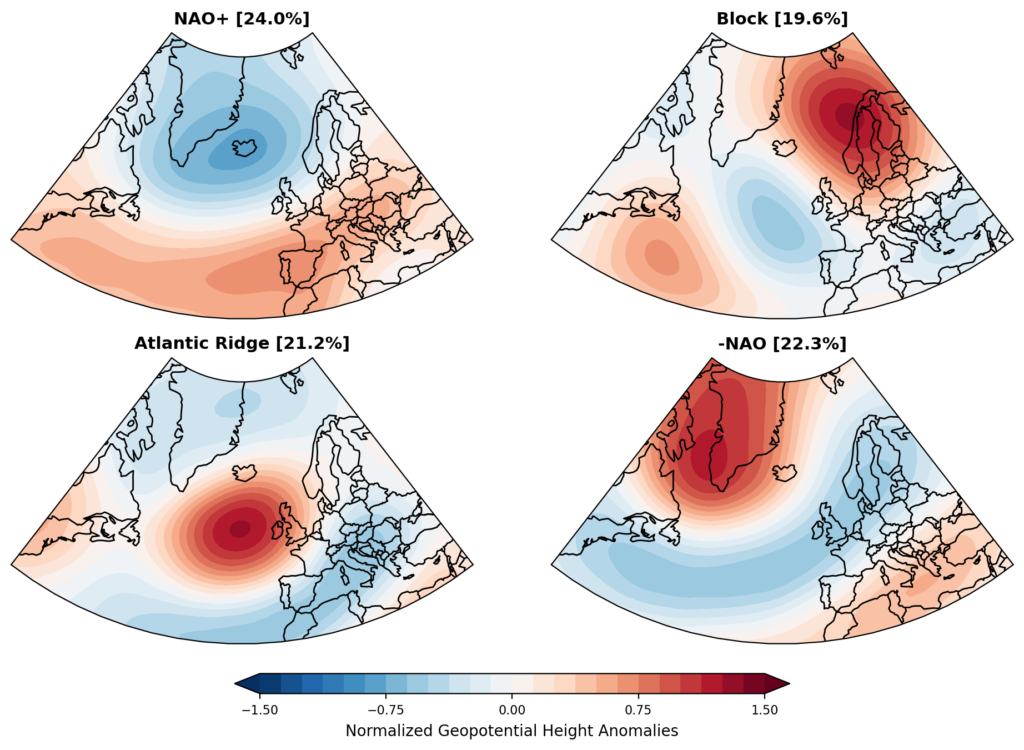
Figure 3. (a) Europe Regimes in Winter and (b) Europe Regimes in Summer.
The regime probability view makes it easy to see when a dominant regime emerges and how probabilities shift from one forecast run to the next providing insight into forecast stability and confidence, as shown in Figure 4.
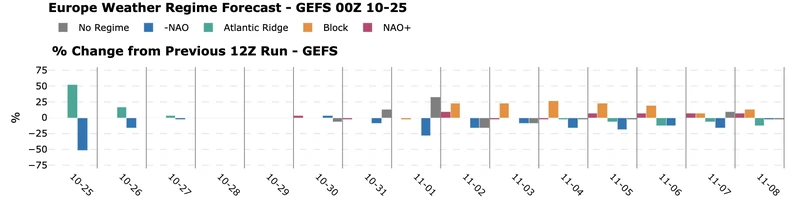
Figure 4. An analysis of the forecast run-to-run changes in the probability of regimes by lead time.
Selecting any forecast day in the regime tool reveals a detailed breakdown of the forecast regime and its impacts on surface variables, as shown in Figure 5.
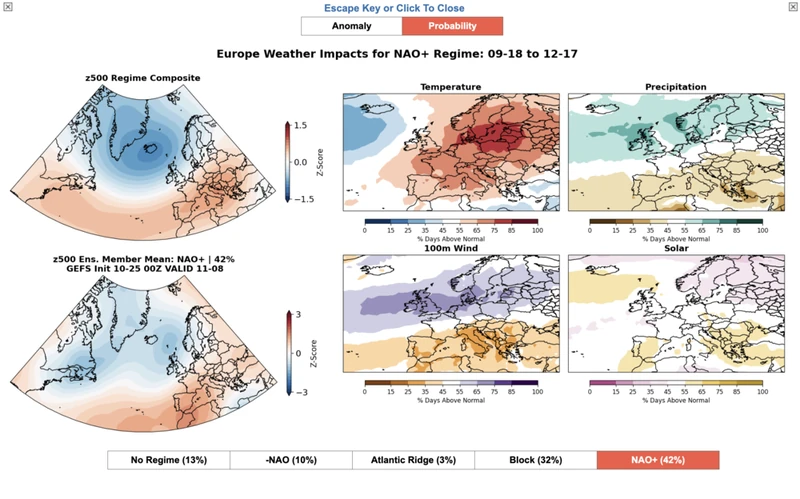
Figure 5. The regime impact analysis shows both the 500m height canonical regime (top) and the ensemble-averaged 500 mb height forecast for the regime ensemble matching members (bottom). Also shown is the impact of the canonical regime pattern on temperature, precipitation, wind speed, and solar radiation.
The analysis shows:
- Upper-air pattern of the regime: The canonical 500 mb height pattern of the selected regime.
- Ensemble mean upper-air pattern: The ensemble-mean 500 mb height anomaly pattern for the predicted regime.
- Surface Impacts: Typical temperature, wind, solar radiation, and precipitation anomalies associated with that regime.
- Anomaly and Probability Views: Toggle between standardized anomaly and percent-above-normal perspectives for a clearer view of risk skew.
This structured, physically grounded approach turns model chaos into interpretable meteorological intelligence.
Weather Regimes Forecast: The Science Behind the Curtain
The WCS regime classification follows the methodology of Lee (2023) and subsequent literature. It uses ERA5 reanalysis data (1980–2024) to create a 45-year record of 500 mb geopotential height anomalies over North America and Europe. The data are detrended to remove long-term climate signals, standardized to capture relative variability, and reduced to key patterns using Principal Component Analysis (PCA). These patterns are grouped into a small number of recurring flow regimes with k-means clustering. Forecast model data are then projected into this established regime space to identify the most likely daily regime. The result is an objective, climate-adjusted framework that translates ensemble forecast output into clear, actionable atmospheric patterns.
Ensemble Weather Regimes Forecast vs. Ensemble Clustering
One of the most requested features by World Climate Service customers over the years has been ensemble cluster analysis of the subseasonal forecast data. The emergence of weather regime analysis presents an opportunity to provide a similar analysis capability that is more appropriate for the long-range forecast application for which the World Climate Service is known.
Weather-regime analysis offers a higher-level, physically interpretable classification of large-scale atmospheric patterns (e.g., distinct flow regimes) that persist for days to weeks, whereas an ensemble cluster analysis typically groups forecast states purely based on the similarity of ensemble forecast members. Thus, regime analysis provides enhanced interpretability, persistence signal, and decision-relevance for energy and trading applications. Ensemble cluster analysis excels at characterizing shorter-term forecast uncertainty and short-lead divergence.
Weather Regimes Forecast: Physical interpretability & decision relevance
A weather-regime framework identifies familiar large-scale circulation patterns (e.g., Greenland High, Pacific Ridge) that can be directly linked to surface impacts (temperature anomalies, wind generation risk, etc). In contrast, a pure ensemble cluster might group trajectories that are statistically similar but may lack a clear, well-known physical meaning or long-lead relevance.
For example, recognizing a transition into a “Greenland High” regime immediately signals colder-east U.S. and wind-suppressed conditions in the ERCOT power market not just a statement that “model members are diverging,” that might arise from a cluster analysis.
This interpretability matters for trading and energy operations because regime shifts can be connected directly to energy business risks (e.g., reduced wind output, temperature demand spikes). An ensemble cluster analysis requires another analysis step relating the cluster patterns to ground surface level weather impacts.
Weather Pattern Persistence and the Low-Frequency Signal
Weather regimes typically persist across days and sometimes weeks. Categorizing a forecast into a regime provides a “low band pass filter” on the forecast information that focuses on the longer timescale influences of the forecast. Weather regime forecast users can better anticipate how long a pattern may persist.
Ensemble cluster analysis tends to reflect immediate spread/spread-states at a point in time. This is useful for weather forecast uncertainty assessment in the shorter lead times of a medium-range forecast, but the high-frequency variations may create spurious clusters.
The regime lens is valuable to power and natural gas trading strategies dependent on the longer time frames of the medium-range and subseasonal climate forecasts. The low-frequency analysis focuses on what the subseasonal weather drivers impact, such as renewable generation, storage, and demand, in an easy-to-communicate way.
For example, if an ensemble forecast suggests dominance of a Pacific Trough regime for the next 10 days, you infer extended wind-generation risk across western U.S., versus simply knowing the ensemble members diverge.
Communication With Trading Desks: Simplification & Actionable Messaging
Regime classification reduces complex ensemble output down to a few discrete categories (and probabilities). That simplifies communication to non-meteorologists: “We expect a Greenland High dominance” vs. “the ensemble median is this, spread this, but there is a 30% chance of scenario X.”
For trading desks or energy operations, that simplification enables faster decision-making and less “forecast risk paralysis.” The meteorologist supporting trading desks is better able to discuss the likely weather conditions driving the long-term market narratives.
Ensemble clusters, while rich in information, often require more nuance and explanation. It’s difficult to describe that the “Ensemble members cluster into three modes; the first one has the highest probability, but I think the 2nd one is the biggest risk.” Energy trader domain expertise is sometimes required to convert the ensemble cluster information into actionable trading decisions.
Weather Regimes Enable Easy Linking to Other Subseasonal Phenomena
Regimes often integrate teleconnection patterns such as the NAO, blocking, and significant ridge/trough atmospheric states that drive large-scale impacts to energy systems. These can result in substantial energy demand changes, renewable generation shifts, and extreme events.
Therefore, regime forecasts provide a bridge between long-range forecast model output and downstream energy systems impacts more directly than raw ensemble forecast clusters.
In contrast, ensemble‐cluster analysis may identify statistical groupings of future outcomes, but without embedding those teleconnection/impact linkages unless explicitly built in to the analysis.
Weather Regimes are Most Suitable for Long-lead Forecast Horizons
Because regimes operate on lower-frequency variability over many days and weeks, they are better suited for medium-range (7-15 day) and subseasonal (2-6 week) forecast horizons. Weather regime analysis becomes another tool for long-range forecasting and weather-based power/gas trading analysis.
Ensemble cluster methods are excellent for shorter lead times in the zero to ten-day time frame because they help quantify forecast uncertainty. However, the cluster skill often degrades for longer lead times.
Weather regimes provide a structural framework for longer-lead forecasting by focusing on pattern persistence and regime transitions.
Weather Regimes Forecast: Trade-offs and Limitations
While weather regime analysis simplifies and increases interpretability, it also reduces forecast resolution. For example, it reduces the granularity of individual ensemble members and the geographic detail of specific forecast information.
Ensemble clustering retains the ensemble member spread information, which helps to quantify forecasts and explore “what-if” scenarios with more detailed forecast information.
Ensemble cluster analysis outperforms regime-based analysis for very short lead times or highly local phenomena such as convective storms.
What Are the Implications of Weather Regime Forecasts for Energy/Trading Users
Energy meteorologists and the traders they support should use weather regime forecasts when the trading decision horizon is multi-day and when an easy-to-communicate narrative is required.
Meteorologists and traders best apply the ensemble clustering technique when managing near-term weather forecast uncertainty requiring detailed probabilistic profiles.
For communication to traders, emphasize regime forecasts for clarity and decision speed; highlight ensemble‐cluster results when exploring extreme tails or scenario charts.
Summary: Weather Regimes versus Clustering
This table summarizes a comparison of weather regime forecasts to ensemble clustering.
| Comparison: Weather Regime Analysis to Clustering | ||
| Aspect | Weather Regime Analysis | Ensemble Forecast Cluster Analysis |
| Primary Goal | Identify and track persistent, large-scale circulation patterns (ridges, troughs, blocking highs/lows) that drive long-range weather predictability. | Quantify forecast uncertainty by grouping ensemble members with similar atmospheric states or trajectories. |
| Basis of Analysis | Analysis of historical 500 mb heights defines recurring regimes; forecasts are projected into these predefined patterns. | Forecast ensembles are clustered dynamically based on current model output similarity; no reference to long-term climatology or the reoccurrence of patterns. |
| Interpretability | High because each regime (e.g., “Greenland High,” “Pacific Trough”) represents a physically meaningful, recurring pattern linked to temperature, wind, and solar anomalies. | Lower because clusters show model spread but may not correspond to known meteorological phenomena or persistent flow regimes. |
| Forecast Horizon Applicability | Strong for medium-range (7–15 day) and subseasonal (15–46 day) horizons, where persistence and teleconnection influence matters most. | Strongest for short- to medium-range (1–10 day) uncertainty and ensemble spread visualization; skill diminishes at long leads. |
| Persistence Signal | Intrinsic — regimes describe atmospheric “modes” that naturally persist for days to weeks. | None — cluster memberships can change abruptly between forecast cycles. |
| Use for Traders | Provides clear pattern-based narratives (e.g., “Greenland High → cold U.S. East, low ERCOT wind”) that connect forecasts to energy-market risk. | Helps gauge confidence intervals or alternative scenarios in temperature or demand forecasts. |
| Communication Value | Excellent — simplifies model chaos into a few meaningful regimes; easy to brief non-meteorologists and trading teams. | Moderate — requires expert interpretation of model member clusters; harder to summarize surface weather impacts succinctly. |
| Connection to Market Impacts | Direct — regimes are statistically tied to power demand, renewable generation, and curtailment events. | Indirect — clusters must be manually analyzed for impact relevance. |
| Limitations | Reduces detail; cannot represent localized or rare patterns not captured in regime set. | May be noisy; less physically interpretable and less consitent between runs. |
| Best Use Cases | Identifying pattern persistence, transitions, and long-lead forecast risks; communicating confidence in subseasonal forecasts. | Understanding ensemble uncertainty in the near term; diagnosing model divergence or forecast volatility in shorter forecast timescales. |
| Ideal Combined Workflow | Use regimes for high-level pattern guidance → use ensemble clusters to explore uncertainty within each regime. | Complementary to regime analysis for operational forecasting. |
Power Trading Decision-Making: How do regimes help?
Energy meteorologists now have a new diagnostic lens to identify when forecasts include a high-impact circulation regime and their transitions, communicate long-range forecast confidence in simple, pattern-based language, and quantify the likelihood of persistent weather conditions that drive power demand, renewable supply, and storage behavior.
For power and natural gas traders, the regime framework supports earlier detection of pattern persistence and regime transitions. This capability is key to capturing market opportunities tied to weather-driven price shifts and improving energy trading portfolio performance.
Explore the New Regime Forecasts in WCS
The Weather Regime Forecast capability is now available within the World Climate Service for both North America and Europe. This new perspective helps energy meteorologists and trading teams cut through the noise, focus on meaningful atmospheric shifts, and make better-informed decisions about weather-related market risks.
Request your trial of the World Climate Service here to gain access to the weather regime forecasting tool.
Grams, C., Beerli, R., Pfenninger, S. et al. Balancing Europe’s wind-power output through spatial deployment informed by weather regimes. Nature Clim Change 7, 557–562 (2017). https://doi.org/10.1038/nclimate3338
Lee, Simon H., M. K. Tippett, and L. M. Polvani, 2023: A New Year-Round Weather Regime Classification for North America. Journal of Climate, 36, 7091-7108. DOI: 10.1175/JCLI-D-23-0214.1