Commentary by Prescient Weather co-founder Richard James, Ph.D
Introduction
The winter of 2020-21 has produced a remarkable sequence of temperature extremes across the mid-latitudes of the Northern Hemisphere. Among the more notable events are the following:
- Cold developed in central and eastern Asia in December and culminated in Beijing’s lowest temperature for more than 50 years on January 7. But just six weeks later, Beijing broke its previous all-time record for winter warmth by an extraordinary 5°C margin.
- Spain saw extreme cold and paralyzing snowfall in January, including -16°C and 18 inches of snow in Madrid.
- A severe freeze caused havoc in Texas, with millions of residents suffering from blackouts and frozen pipes. Economic damage is estimated at $20 billion or more.
- In a dramatic reversal from cold earlier in the month, Sweden saw its highest temperature of any winter month on February 25.
In the wake of these extremes – and particularly in light of the damaging Texas freeze – there has been widespread discussion of changing frequencies of extremes and the role of climate change. On the one hand, it is commonly observed that high temperature records are frequently being broken, and sometimes by very large margins – as in the case of Beijing and many other East Asian locations in February. In contrast, a more subtle point – but one that is being promoted quite widely – is that rapid Arctic warming is disrupting the high-latitude winter circulation and allowing cold to spill south with increasing frequency, leading to extreme cold episodes at mid-latitudes, such as the Texas freeze.
As these talking points circulate in the media, it is natural to ask, “Which is it?” Are extremes increasing in both directions? Is the mid-latitude climate truly becoming more volatile, with unprecedented extremes of both cold and heat? Detailed investigation is of course a topic for academic circles, but it’s worth taking a simple look at the modern ERA5 reanalysis to see if there is any evidence of an increase in temperature extremes.
ERA5 Temperature Extremes
To explore the frequency of unusual temperatures in the ERA5 data, I calculated a 1981-present daily history of temperature departure from normal across the global 0.25×0.25 degree ERA5 grid. For “normal” I used a smoothed daily climatology calculated over 1981-2020, and I normalized the temperature anomalies by dividing by the local standard deviation (which also varies with time of year). I also calculated the 1981-2020 linear trend (also seasonally varying) so that I could look at detrended temperature anomalies.
As an example of the analysis, the map below shows the standardized temperature anomaly relative to trend on February 15 this year, when the recent cold outbreak was at its peak over the south-central USA. The daily mean temperature was more than 3 standard deviations below the linear trend across a wide area in the central and southern Plains, and in a few spots the ERA5 data showed a -5 SD anomaly.
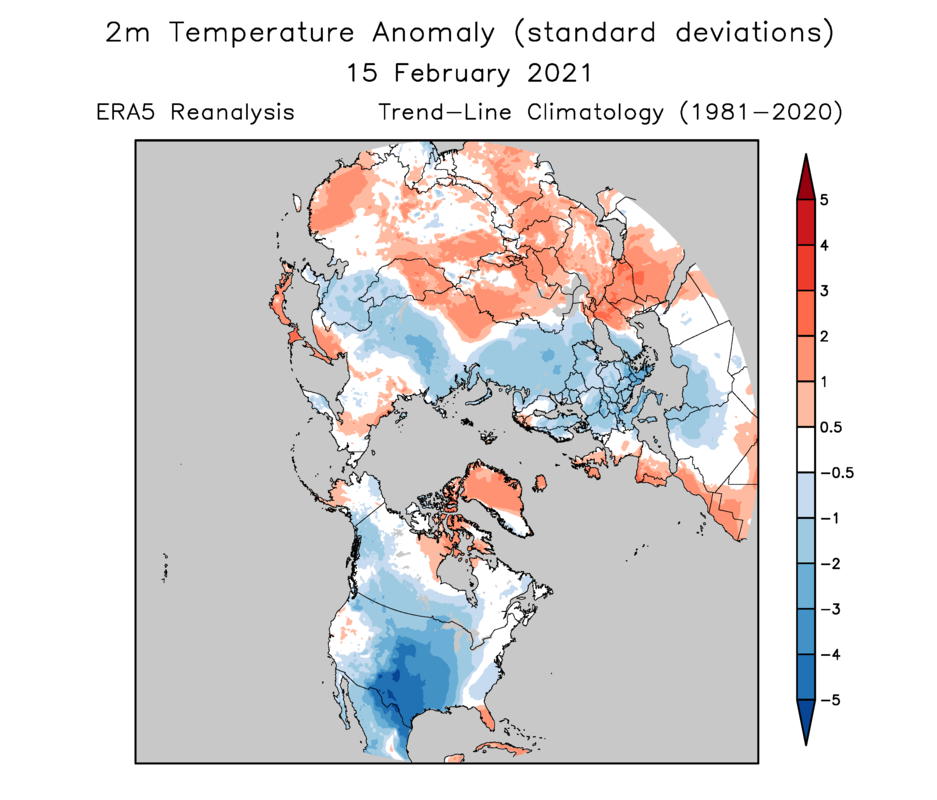
How does this compare to previous severe cold outbreaks across Northern Hemisphere land areas? One way to answer this question is to calculate the land area covered by temperature anomalies below a certain threshold. For instance, on February 15, daily mean temperatures were more than 3 SD below the linear trend over 4.7% of the land area between 30 and 60°N. Compare this to the notorious cold outbreak of December 1983; on the 24th of that month, the 3SD cold area was 7.2%:
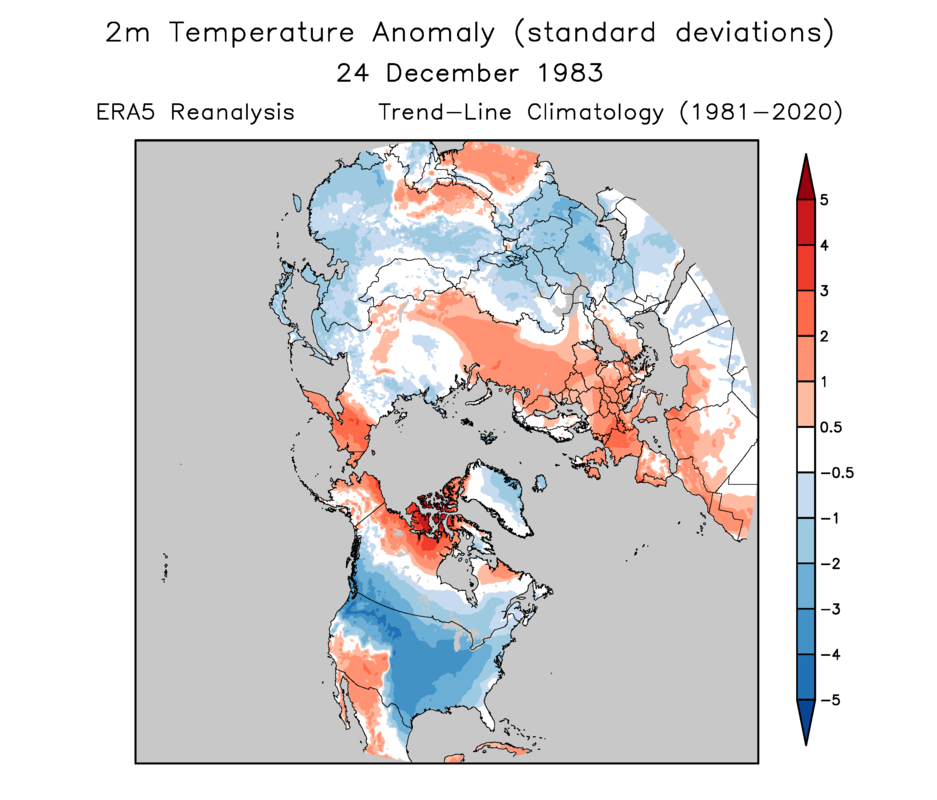
In terms of standard deviations, 24 December 1983 holds the record (1981-present) for most area below -3 SD between 30 and 60°N, both in the detrended analysis and in reference to the fixed 1981-2020 normal. Second in the list for detrended cold is December 16, 1997, when eastern Europe was affected (6.5% of 30-60°N land area below -3SD).

If we look at the recent Texas cold without removing the long-term trend, the anomaly looks slightly less extreme: 4.5% (instead of 4.7%) of 30-60°N land area below -3SD, and the 1983 record rises from 7.2% to 8.2%.
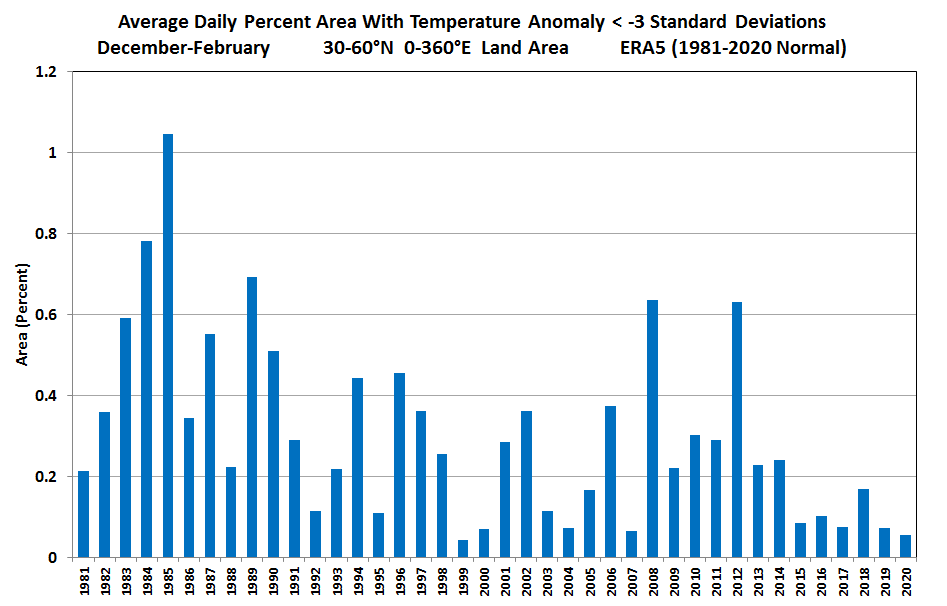
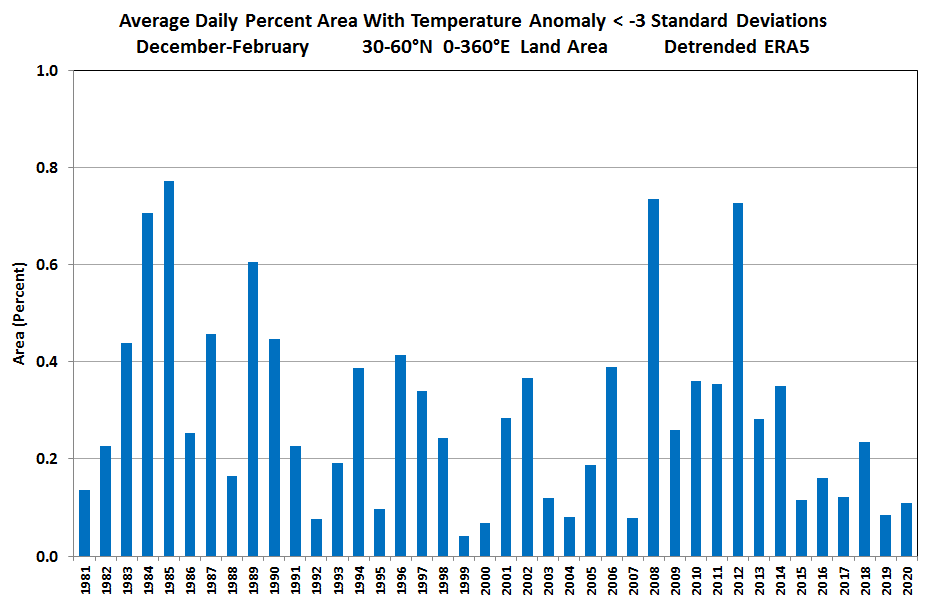
Now let’s explore the long-term trends in extremes. First, the chart below shows the 30-60°N land area that experienced 3SD cold in the winter months from 1981-2020, without detrending. (Note that I haven’t grouped the winter months together – these are simple averages by calendar year for Dec, Jan, Feb.) The downward trend is clear; cold temperature extremes are becoming less common on an absolute basis. No surprise here.
When we use detrended temperatures, the trend in cold extremes is also largely removed, as we might expect. But this is an important result: even when we account for the higher temperature baseline of today, cold extremes do not seem to be increasing.
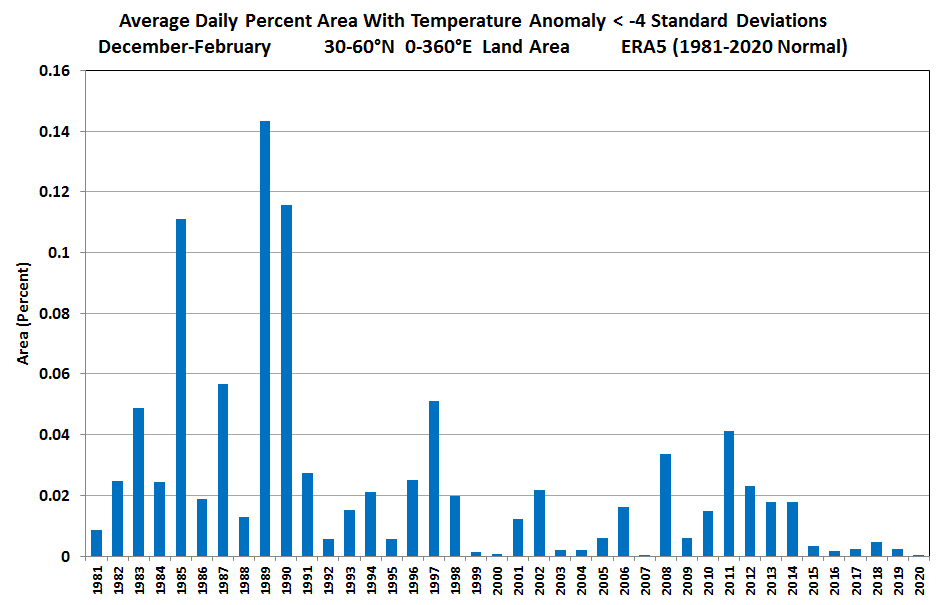
This conclusion is even more compelling if we examine cold extremes at a -4SD threshold. Using a static climatology, the drop-off over time is dramatic:
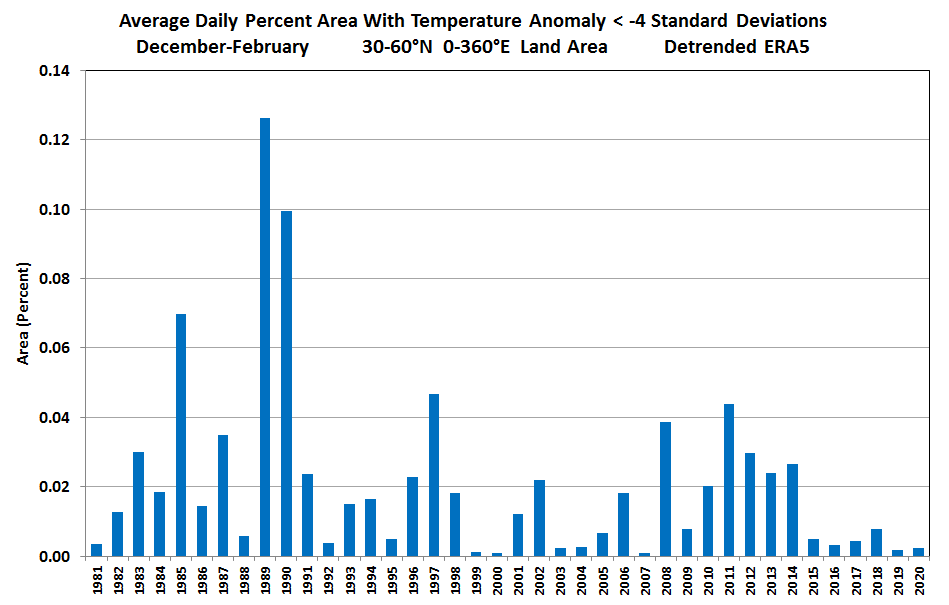
Remarkably, the detrended data also suggest a downward trend – see below – although the trend might not be statistically significant because of the two outliers in 1989 and 1990. Nevertheless, there’s certainly no support for the idea that mid-latitude cold extremes are occurring more widely these days, even in comparison to the modern warmer baseline.
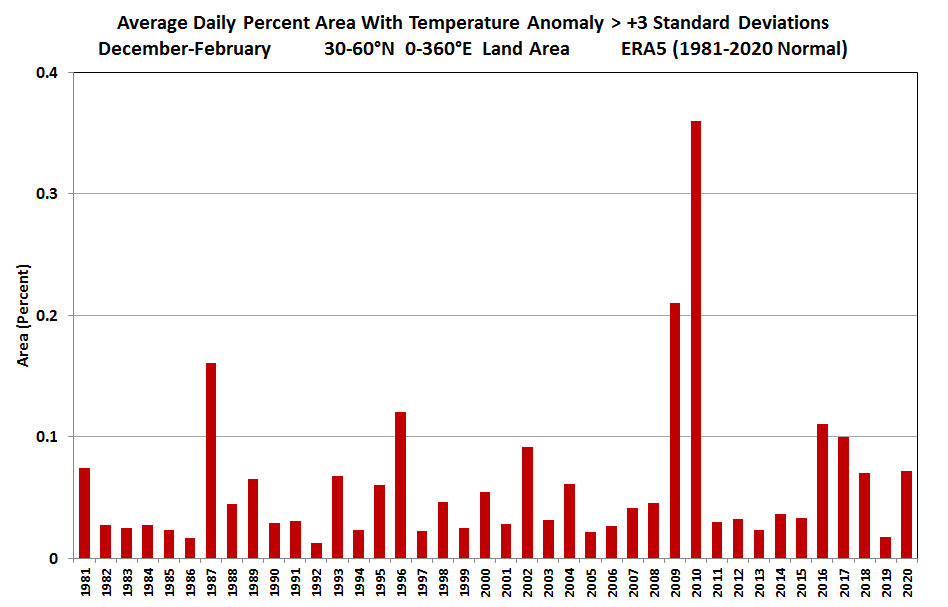
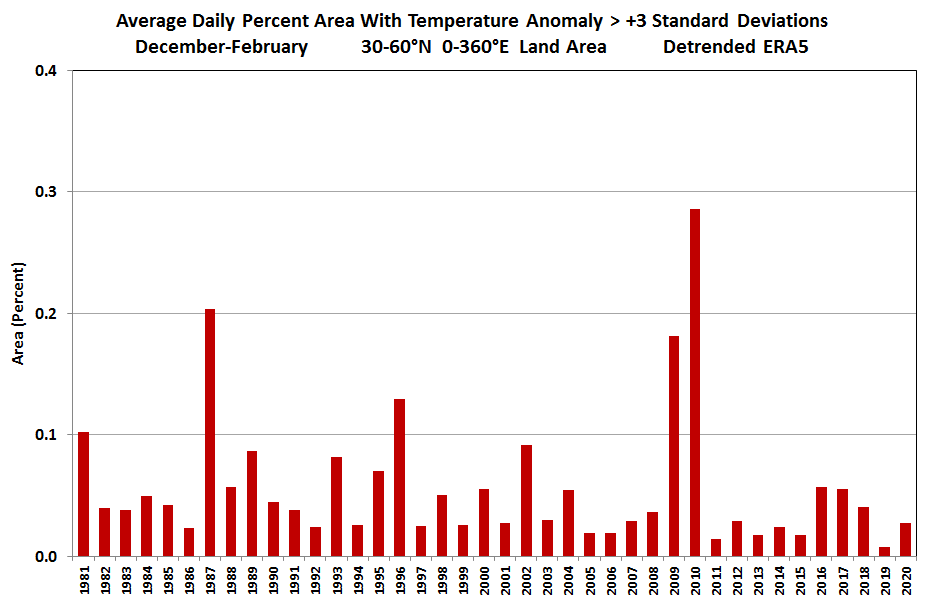
How about extreme warmth in winter? In absolute terms there is perhaps less of an increase than we might anticipate – see below. Interestingly there was a big spike in 2009 and 2010, and this is undoubtedly associated with the extreme and persistent blocking patterns in those winters. We typically think of blocking as producing cold outbreaks – and it does – but it’s often overlooked that counterbalancing extreme warmth also occurs in other locations during such regimes.
In detrended terms, the past decade has seen relatively few warm extremes in winter, and the overall trend seems to be down except for 2009-2010.
The suggestion of a downward trend in both warm and cold extremes in the detrended data points to the possibility that the variance of winter temperatures may actually be decreasing rather than increasing. Intuitively, this is actually what we would expect, because the north-south temperature gradient is decreasing as the Arctic warms more than the tropics (so-called “Arctic Amplification“).
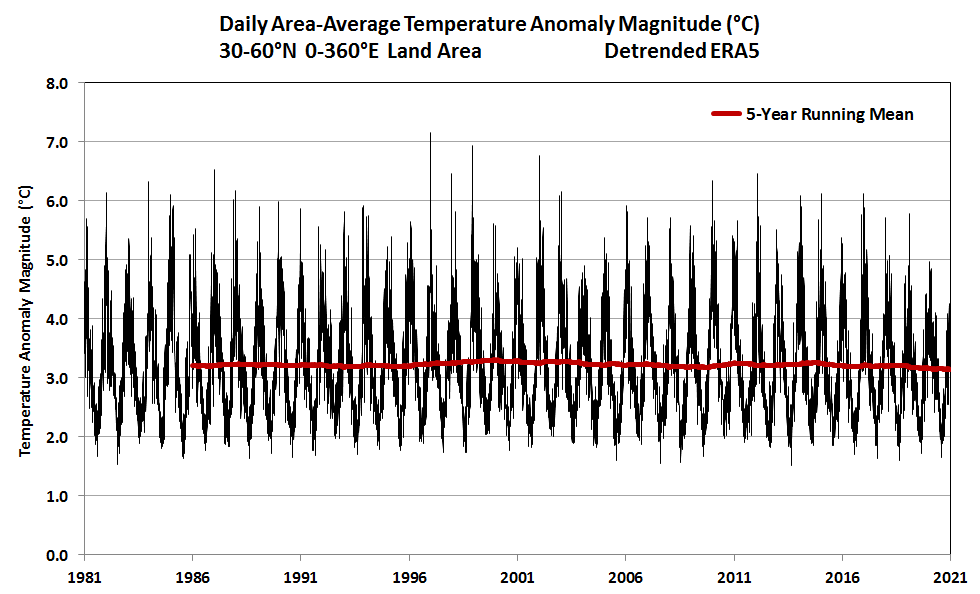
To gain another viewpoint on possible changes in variance, I calculated another daily history for 30-60°N, this time looking at the daily land area average of the size (amplitude) of temperature anomalies. This isn’t the same thing as measuring variance in the time dimension, but it does capture changes in the average magnitude of temperature swings. The chart below shows the 40-year history of low variability in summer and high variability in winter, and there’s no dramatic change in the running mean. However, it is intriguing to note that the 5-year running mean reached its lowest point in the history in the last two years. Again, this argues against the idea that mid-latitude temperature is becoming more volatile.
Summer Temperature Extremes
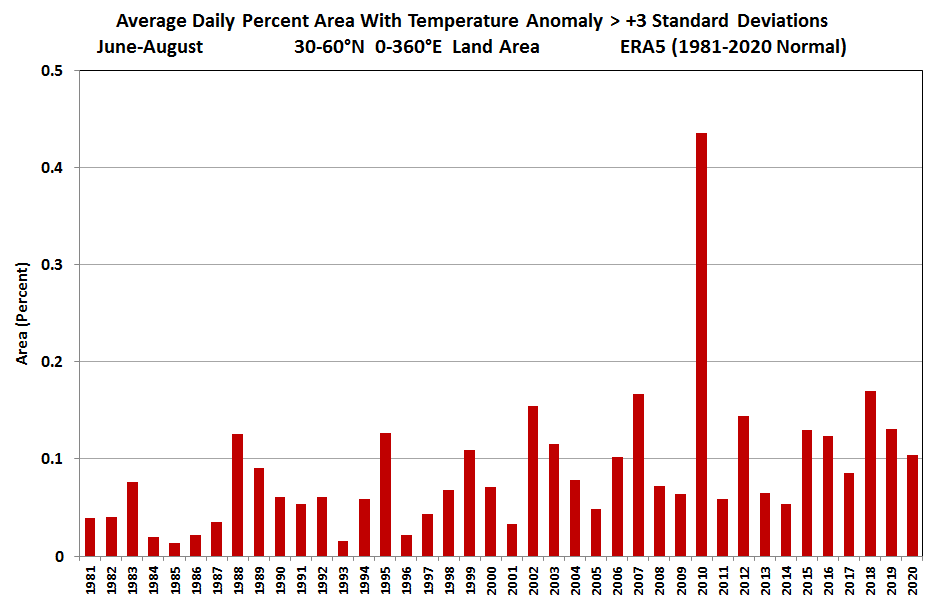
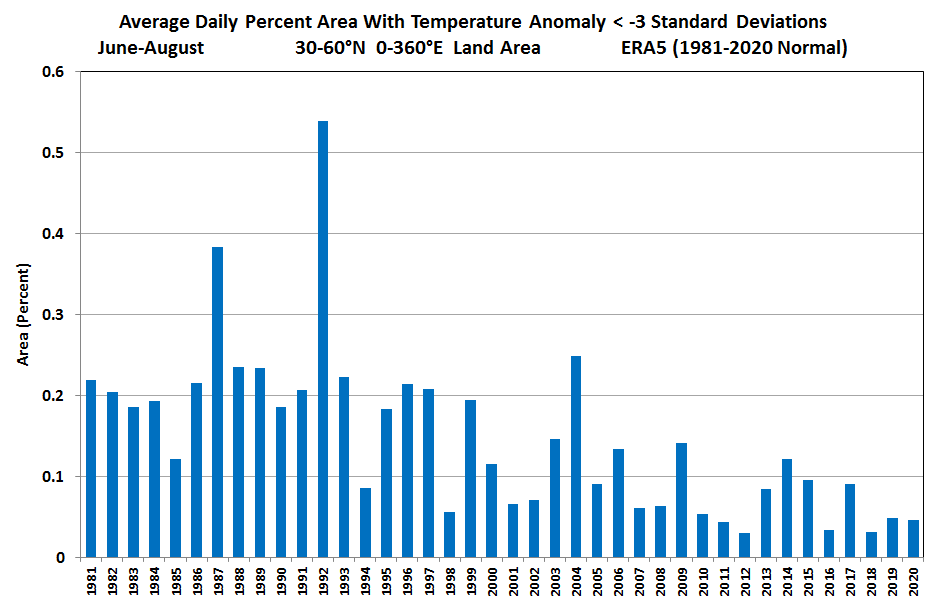
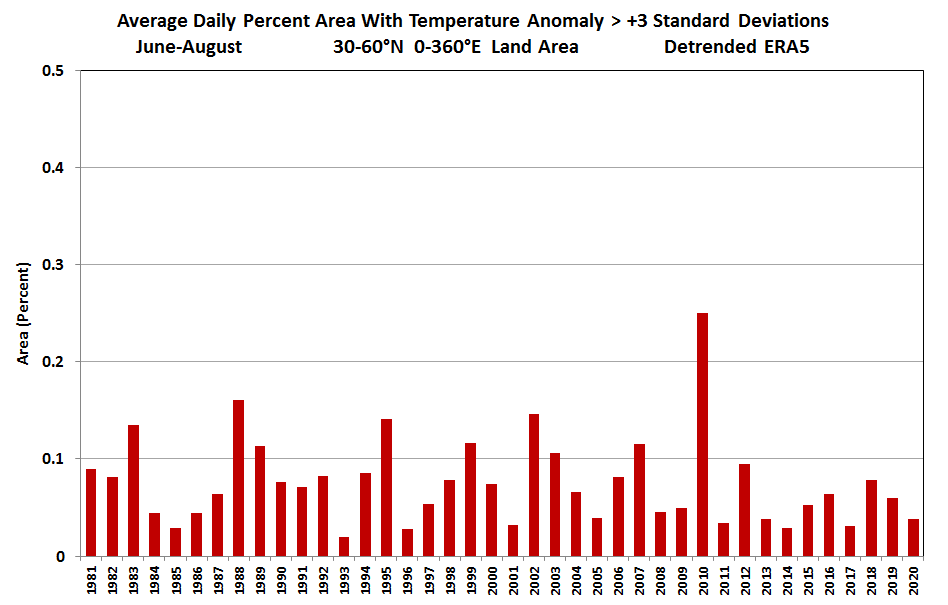
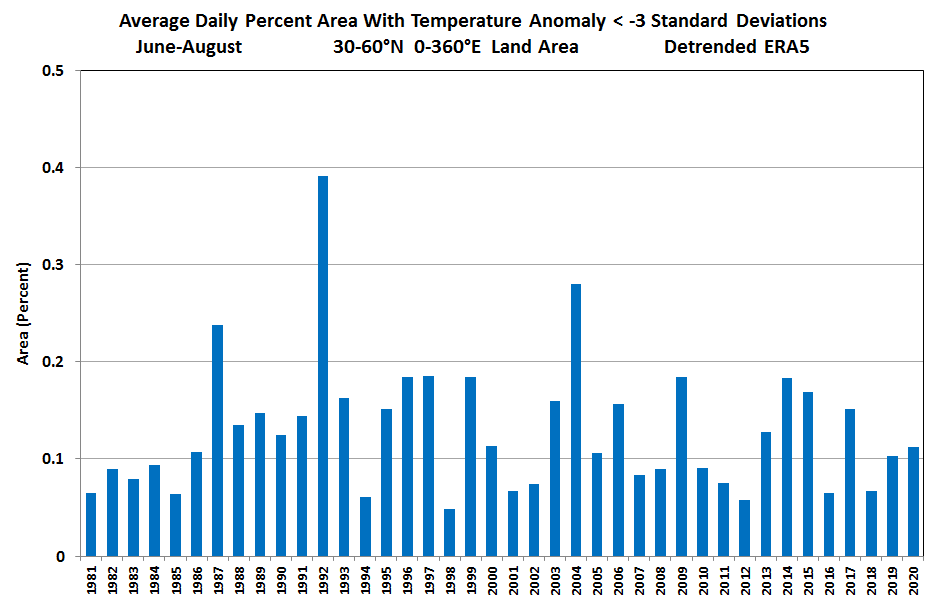
To complete the discussion, the charts below show corresponding results for extremes during Northern Hemisphere summer. First, without detrending, we see that extremes of heat have increased, and extremes of cold have decreased dramatically. The summer of 2010 stands out conspicuously for heat, reflecting the numerous heat waves that occurred around the Northern Hemisphere. For cold, summer 1992 was notable, showing the lingering effect of Pinatubo’s eruption.
After detrending, we again see a hint of a decreasing trend in warm extremes (except 2010!), and cold extremes look roughly unchanged.
Conclusion
In summary, ERA5 daily data from 1981 to the present do not support the idea that cold extremes are becoming more common across mid-latitude land areas in Northern Hemisphere winter. Rather, long-term warming trends are clearly evident in diminishing cold extremes, and even detrended temperatures fail to show an increase in relatively cold outbreaks.
Perhaps the most intriguing result is that the ERA5 reanalysis shows hints that temperature variability is actually decreasing, not increasing, in both winter and summer (for 30-60°N land). This would be consistent with a diminishing temperature gradient from equator to pole, and perhaps shouldn’t be a surprise. However, the analysis here is only a cursory look at one data set with simple methods, and much more research is required. It would also be highly worthwhile to look at regional changes in temperature extremes, and to extend the analysis back at least a few more decades for a longer perspective.
Update July 2022: for a look at trends in heat extremes in comparison to background warming trends, check out this post: https://www.worldclimateservice.com/2022/07/29/trends-in-heat-extremes/