Wind Power Capacity Factor Forecasting
Wind power capacity factor forecasting has become a differentiating capability of successful power trading. As a result, power traders and meteorologists expend significant effort to develop proprietary information regarding wind power generation to create a competitive, alpha-generating power trading edge.
Power traders can unlock new trading strategy insights and win more weather-based trades with access to an extensive archive of numerical‑weather‑prediction (NWP) forecasts. Pairing each historical forecast with the concurrent realized wind output in Germany’s onshore and offshore fleets, a capacity‑factor model can be trained that learns how hub-height wind speeds translate into megawatts on the grid.
That archive of weather forecasts is the World Climate Service Point-in-Time Weather Forecast Archive API.
The API supplies the original forecasts starting as early as May, 2017 from the ECMWF, GEFS, GFS, and AIFS-ENS weather forecast models aggregated into wind‑power production‑weighted 100 m wind speeds, the critical variable for wind power forecasting.
The weather forecast archive enables traders to create quantitative analyses of critical aspects of power market pricing dynamics. Figure 1 below, for example, compares the 14-day lead time forecasts of the 00Z ECMWF ensemble average German wind power capacity factor from 2019 to 2024.
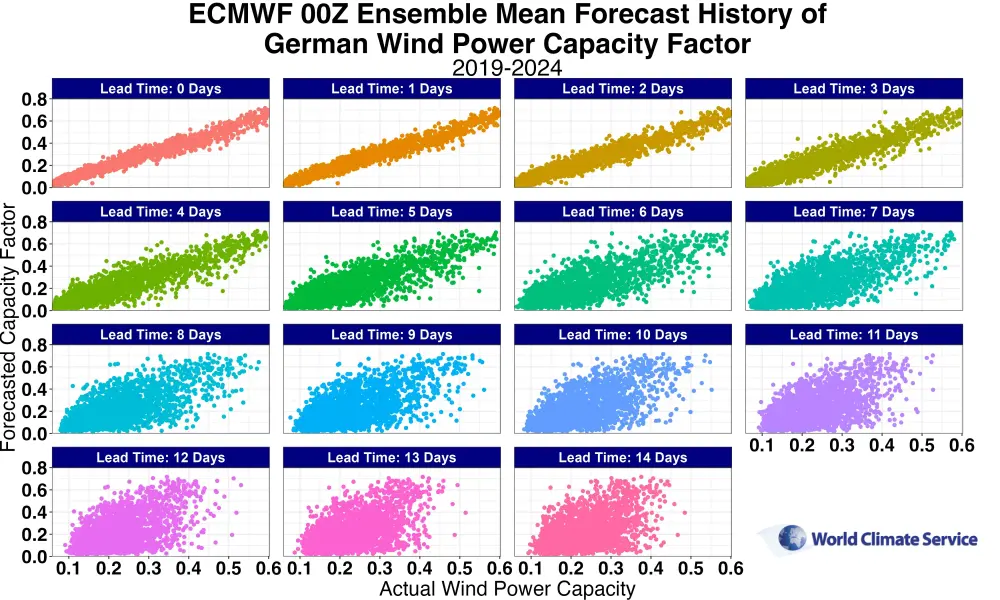
Figure 1. Analysis of the skill of 00Z ECMWF ensemble daily average German wind power capacity factor forecasts.
With this foundation, traders back-test weather-based trading strategies, quantify forecast‑error distributions for option pricing, and ultimately feed day-ahead or intraday bidding algorithms with a probabilistic view of Germany’s wind generation, transforming raw weather data into monetizable trading edges.
The blog post introduces the data and demonstrates the capability of creating a wind power capacity factor forecast. The goal of the post is to highlight the weather forecast archive and discuss the types of weather forecast analysis possible with data from the API.
We demonstrate another application of the Point-in-Time Weather Forecast Archive API in our ERCOT curtailment forecasting post.

Estimating the Wind Power Capacity Factor – Data
The following datasets are essential to creating a wind power capacity factor forecast. They are:
- Wind power generation history – Our source is ENSTO-E historical renewable power generation data for Germany. The 15-minute resolution data is aggregated to daily resolution.
- Market wind power capacity – We use ENSTO-E data to estimate the German market’s daily wind power capacity.
- Historically observed 100m wind speeds – The ECMWF Reanalysis version 5 data provides 100m wind speeds post-processed to calculate daily German market wind power capacity weighted 100m wind speeds. An example of the
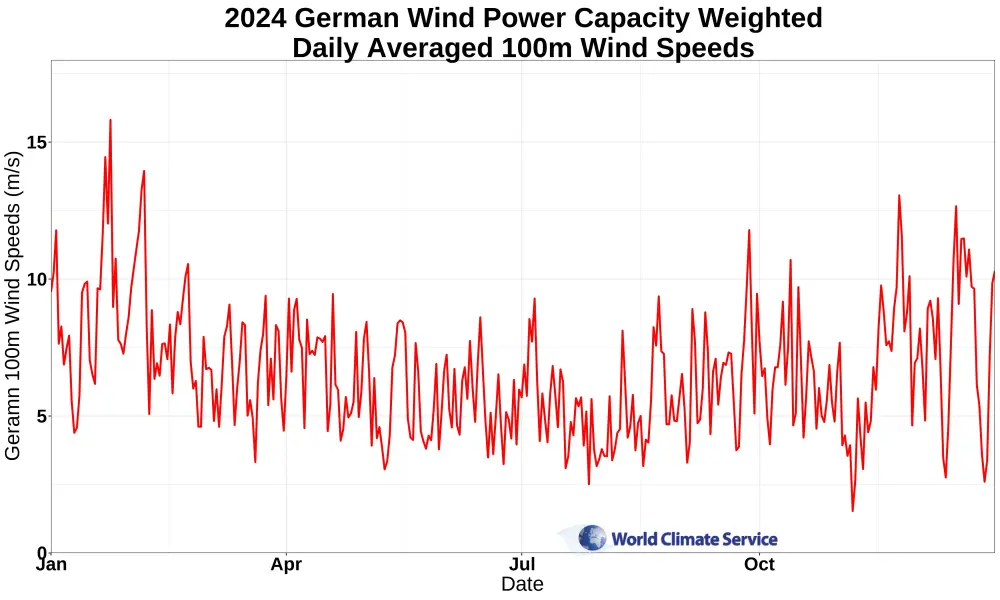
Figure 2. Historical observed German wind power capacity weighted 100m wind speeds during 2024.
- An archive of weather forecast model wind power capacity forecasts. The WCS PiT Weather Forecast archive provides this data. The gridded weather forecast data has been converted to wind power capacity weighted German daily 100m speeds using the historical wind power plant location, capacity, and commissioning date data provide by The WindPower.net. The ECMWF IFS ensemble mean daily German 100m wind speed 00Z forecasts on Mondays during 2024 pulled from the API is shown in Figure 3
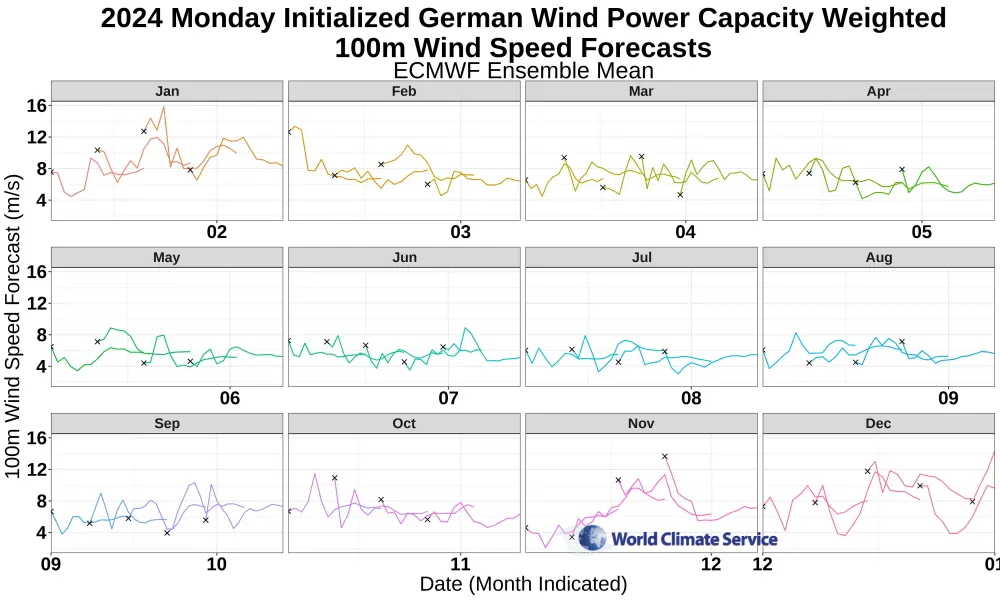
Figure 3. 2024 ECMWF IFS ensemble mean 00Z German wind power capacity weighted 100m wind speeds for all forecasts initialized on Mondays.
Calculating the Wind Power Capacity Factor
The wind power capacity factor is the fraction of wind power generated divided by the total wind power capacity. The total wind power capacity is the amount of power generated if the wind power plant operates 100% effectively.
The ENTSO-E reports accumulated onshore and offshore wind power capacities for each country, including Germany, on the first of each year. For simplicity, we assume the capacity increases in equal amounts between the first day of each year, as shown in Figure 4.
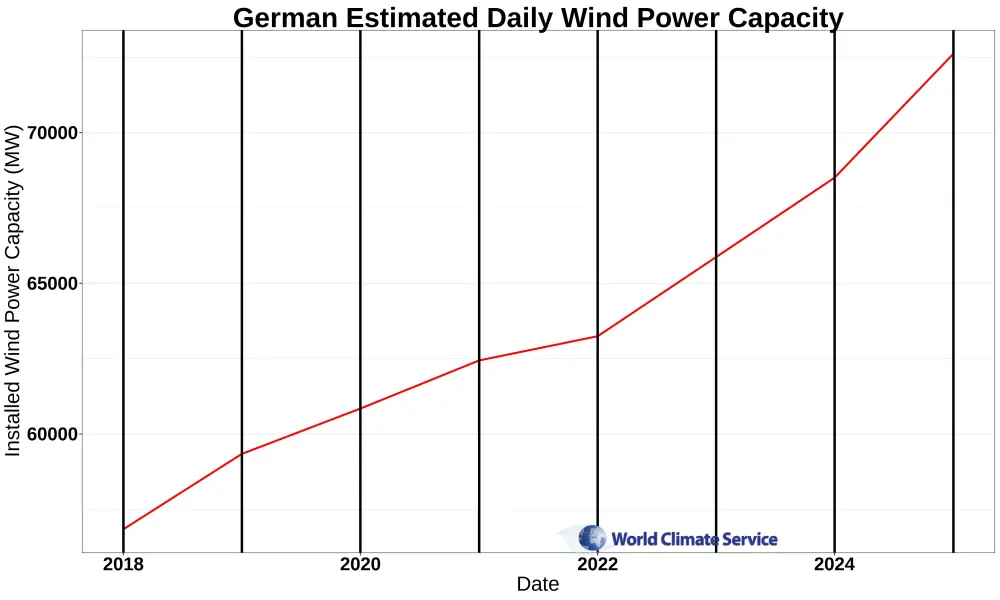
Figure 4. The estimated daily German power capacity from January 1, 2018 to December 31, 2024.
A more detailed analysis is possible by tracking the commissioning date of each wind power plant.
German Daily Wind Power Generation
The ENSTO-E data also includes historical power generation by fuel type with a 15-minute resolution. We’ve accumulated this data to a daily resolution and show an example of the daily 2024 wind power generation in Figure 5.
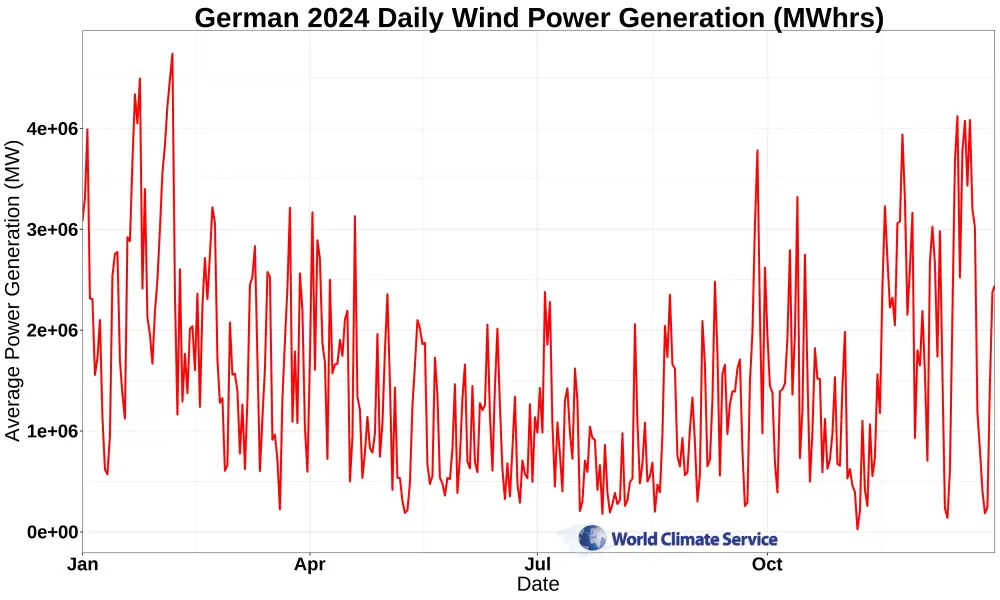
Figure 5. 2024 German daily averaged wind power generation (in MW).
Given historical wind power generation data and German wind power capacity weighted 100m wind speeds, the relationship between the two can be examined. This is shown in Figure 6.
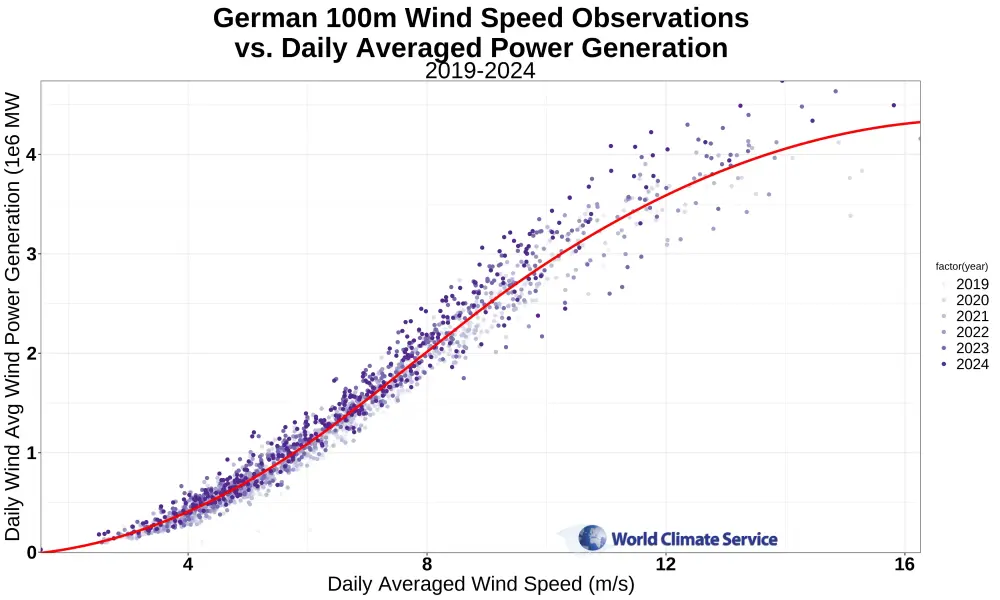
Figure 6. Daily averaged German 100m wind speed vs. daily averaged wind power production.
The individual data points in Figure 6 are color-coded by their year. The graphic shows that more recent years tend to generate greater wind power than earlier years. This occurs because of the increase in wind capacity over time.
German Wind Power Capacity Factor
The increase in wind power capacity over time, shown in Figure 4, is why weather vs. wind power generation analysis is best conducted in terms of the wind power capacity factor. Using the data described above, the daily average wind power generation is divided by the estimated daily wind power capacity. The German daily average wind power capacity factor versus observed 100m wind speeds is shown in Figure 7, below.
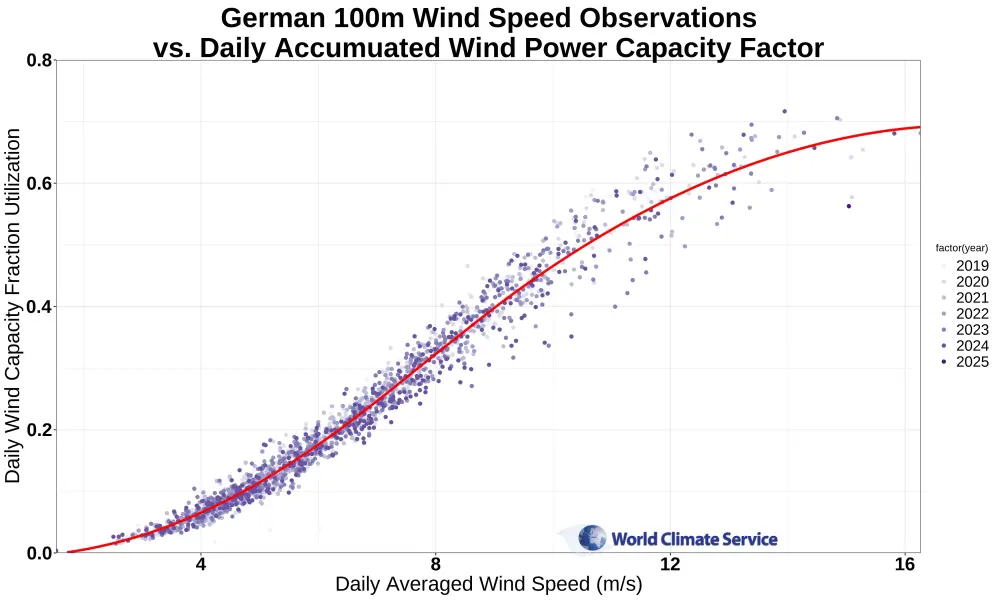
Figure 7. Daily averaged German 100m wind speed vs. daily average wind power capacity factor.
The yearly bias was removed after the wind power generation was transformed to the wind power capacity factor.
The wind power capacity fraction information can now be used to forecast wind power generation. A forecast of the wind power capacity factor multiplied by the current wind power capacity yields a wind power generation estimate.
Wind Power Capacity Factor – Model Fitting
Let’s create that wind power capacity factor forecast.
A random forest regression model is trained to predict the daily averaged wind power capacity fraction from the German wind power capacity weighted 100m wind speeds. The model predict the daily averaged wind power capacity factor from the German daily averaged observed 100m wind speeds, daily averaged temperature, and the month of the year.
The fitted capacity factor model predicts the daily wind power capacity factor using the full ensemble forecast of the 00Z ECMWF IFS model, as provided by the Point-in-Time Weather Forecast API. Figure 7 shows an example wind power capacity forecastFigure 8.
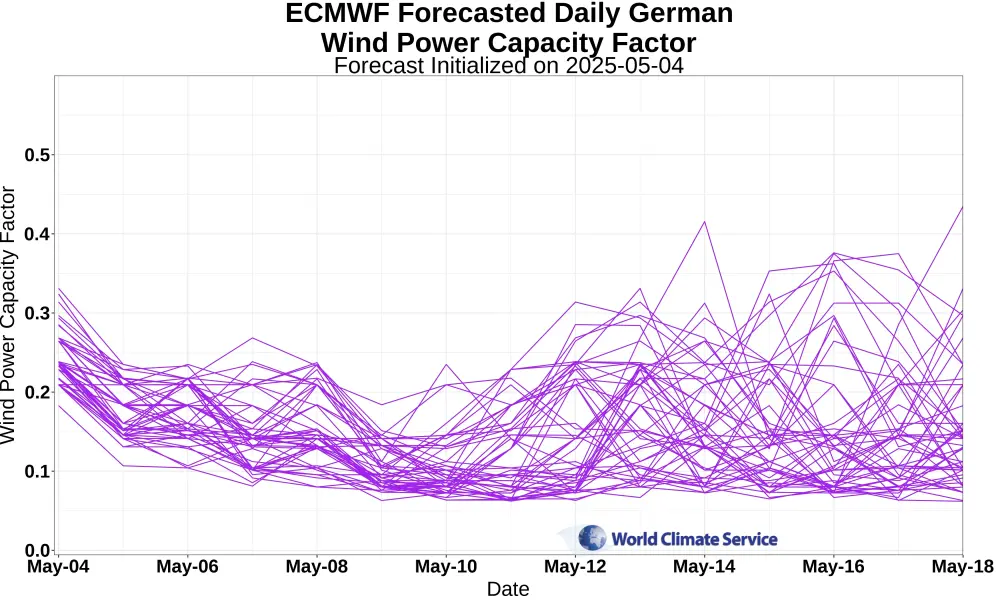
Figure 8. An example ECMWF IFS ensemble wind power capacity factor forecast generated from the model fit using the observed German 100m wind speed data provided by the PiT Weather Forecast Archive API.
Forecast Analysis: Wind Power Capacity Factor Forecasting
With a model fit to convert German wind power capacity weighted 100 m wind speeds to expected wind power capacity fraction, we can examine the historical skill of the ECMWF ensemble 00Z forecasts of the wind power capacity fraction.
The PiT Weather Forecast Archive API ECMWF 00Z German wind power capacity weighted 100m wind speed forecasts from 2019 to 2024 are used. The API provides the full ensemble resolution of the forecast information.
Each ECMWF ensemble member’s wind speed forecast is converted to the wind power capacity factor before the ensemble mean power capacity factor is calculated. This is necessary because of the nonlinear relationship between wind speeds and the wind power capacity factor.
The resulting analysis shows the ECMWF ensemble 00Z forecasts of the wind power capacity factor vs. the actual capacity factor by forecast lead time. This was shown in Figure 1.
Examining the forecast history enables an analysis of the degradation of forecast skill with lead time. A clear progression from skillful forecasts for the “day of” lead day zero forecasts to the 14-day lead time occurs.
Wind Power Capacity Factor Forecast Skill
The progression of wind power capacity factor forecast skill degradation is shown in Table 1.
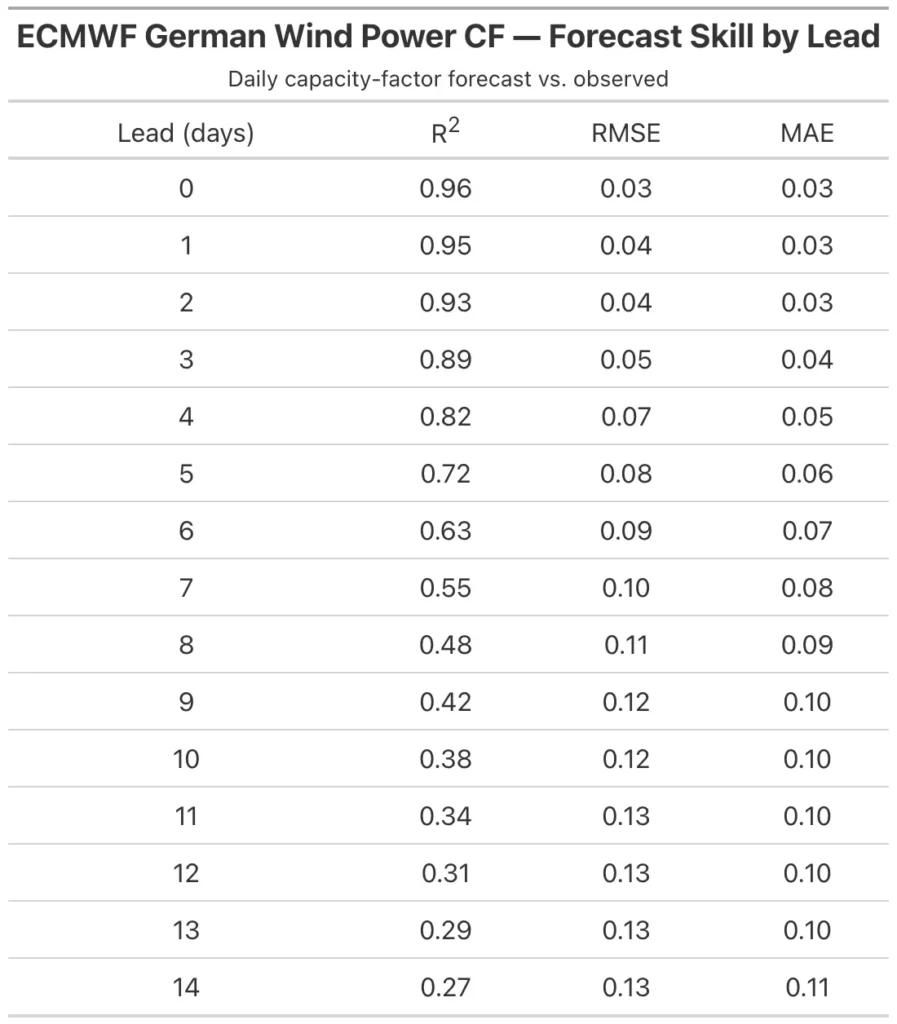
Table 1. Error statistics for the relationship between the ECMWF Ensemble 00Z daily averaged German wind power capacity factor forecasts of the actual daily average wind power capacity factor. The metrics include the R-squared, root mean square error (RMSE), and the mean absolute error (MAE).
A quantitative analysis of the history of the wind power capacity forecasts relative to power prices could reveal the minimum forecast accuracy required to generate profitable trading strategies.
More importantly, the ECMWF forecast archive provided by the PiT Weather Forecast Archive API enables power traders to quantify model skill. A wide range of analysis is possible with eight years of forecast history.
Applications of ENWEX
The forecast history is also used to create a history of German wind ENWEX forecasts. ENWEX is a transparent wind and solar power generation index designed to enabling weather risk hedging.
Conclusion: Testing Wind Power Capacity Factor Trading Strategies
Putting it all together, the World Climate Service Point‑in‑Time Weather Forecast Archive API becomes the keystone of a wind‑trading toolkit:
- One source, full depth – The API offers the original ECMWF, GEFS, GFS, and AIFS forecasts—complete with the model’s contemporaneous biases and upgrade‑induced shifts—exactly as the market saw them on each forecast date.
- Ready‑made power metrics – Every forecast is pre‑aggregated into wind‑power–capacity–weighted 100 m wind speeds, so you spend minutes fitting capacity‑factor models instead of hours wrangling raw grids.
- Historical reach for true back‑testing – Multi‑year snapshots enable a power trader to recreate any trading day since 2018, verify how strategies would have performed, and quantify lead‑time decay with statistical confidence.
- Ensemble resolution on demand – Full‑member access supports probabilistic bids, option‑pricing curves, and VaR stress tests—capabilities impossible with single‑deterministic feeds.
- API simplicity, cloud scale – A Swagger API endpoint returns clean parquet or JSON-formatted data. It can be dropped into R, Python, or SQL pipelines and scale analysis from laptop prototypes to cloud clusters without format gymnastics.
The result is a repeatable, data-driven edge: faster model development, defensible forecast skill metrics, and clearer insight into how weather risk converts into megawatts and ultimately into profitable trading strategies to improve your P&L. The World Climate Service PiT Archive is not just another data feed—it’s the foundation of a sustainable competitive advantage enabling power traders to win more weather-based trades.