In this article, we investigate the Pacific-North American Pattern (often referred to as simply the PNA); what it is, how it impacts the weather, and how we can use it in long-range forecasting.
What is the Pacific-North American Pattern Index (PNA)?
The Pacific-North American Pattern is one of many atmospheric climate indices (climate cycles or teleconnections) that describe the flow pattern over the Northeast Pacific sector. The PNA can shape the weather across North America with characteristic patterns in evidence at different times of the year. Check out and click on the Pacific-North America Pattern Index (PNA) quick summary PDFs for the:
What is the Current Pacific-North America (PNA) Pattern Value?
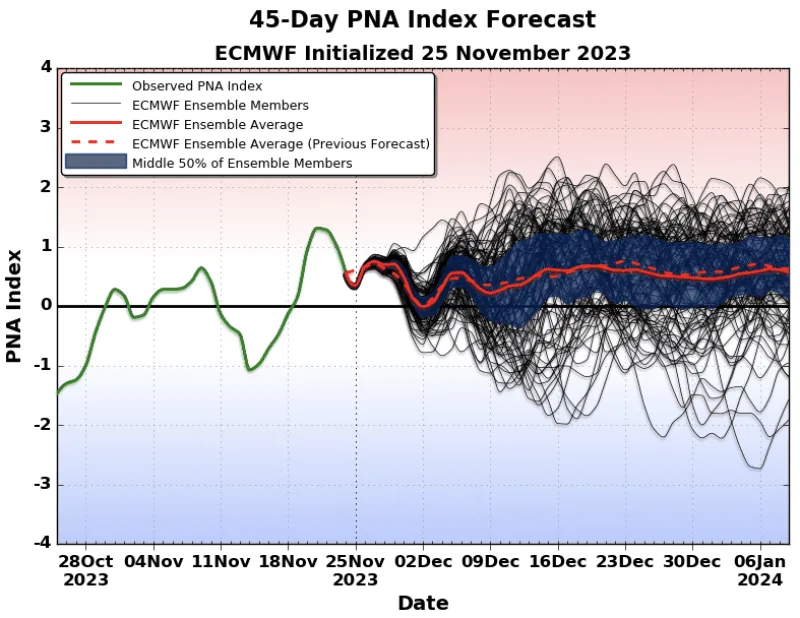
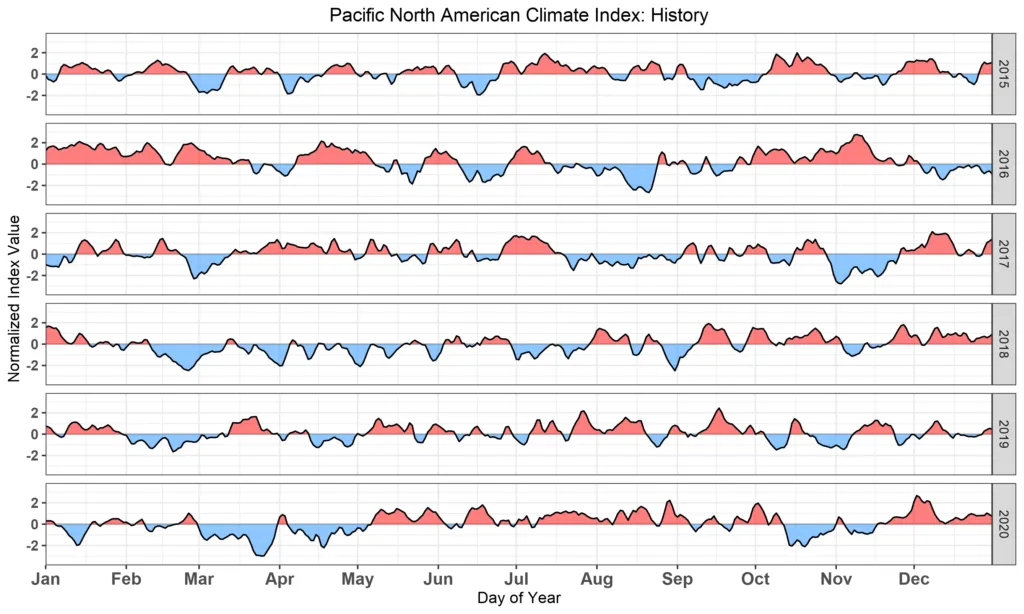
The current PNA pattern value is displayed in Figure 1.
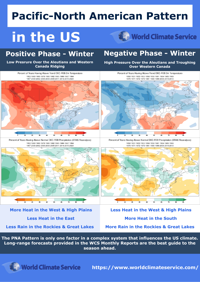
Pacific-North American Pattern – Positive Phase
The PNA is largely driven by the pressure pattern over the Aleutian Islands, which forms a dipole with the pressure over Western Canada. The 500mb maps below show a positive PNA occurs when we see low pressure over the Aleutians and, in winter at least, Western Canada ridging, and a trough downstream over the Southeastern US. See how the Pacific Ridge weather regime best matches with a positive PNA pattern here!
The Pacific-North American pattern is unusual in the sense that the strength of the positive phase in summer determines the pattern which sets up over the lower 48.
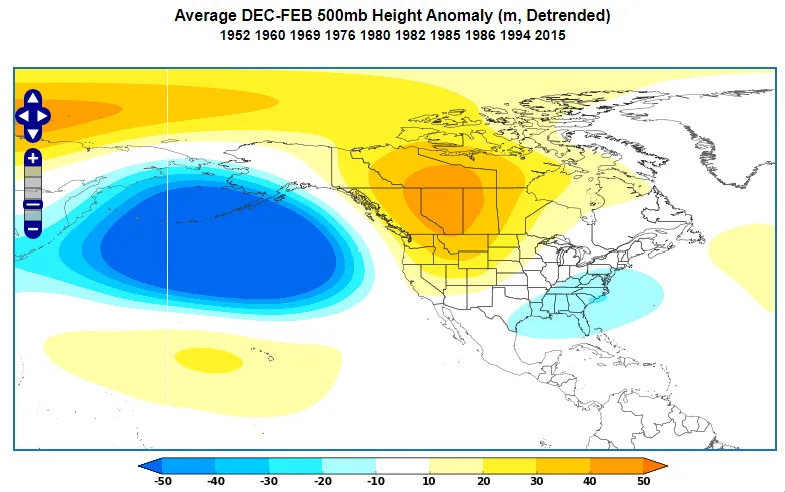
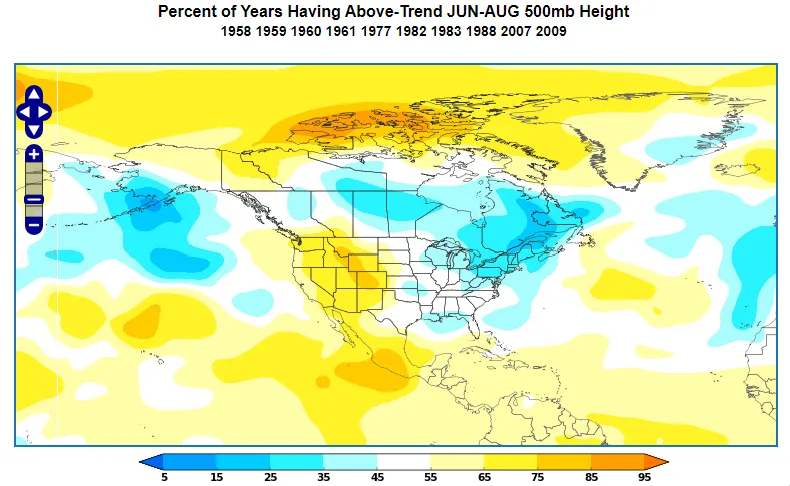
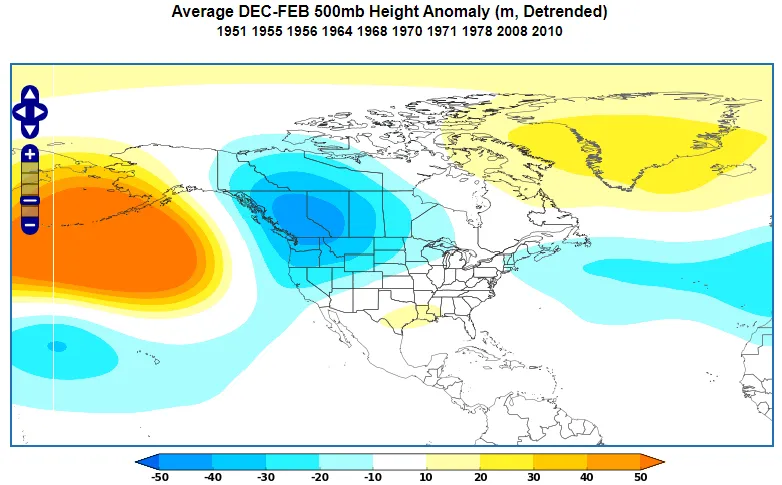
Figure 3. World Climate Service 500mb anomaly map for a strongly positive Pacific-North American pattern summer
A strong positive PNA (Figure 3) sees ridging in the West and troughing in the East. However, if the PNA is only moderately positive, then we see a very different pattern. Troughing develops in the North and West and the South sees ridging (Figure 4).
Pacific-North American Pattern – Positive Phase Impacts
Winter
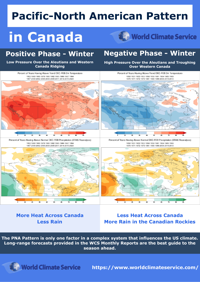
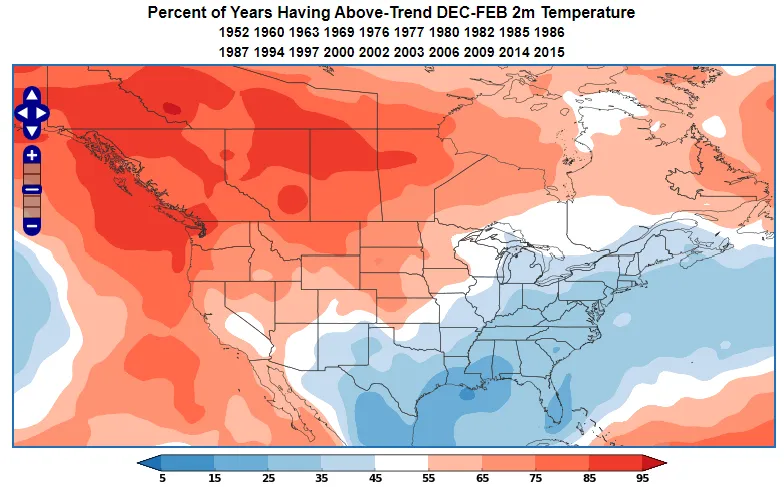
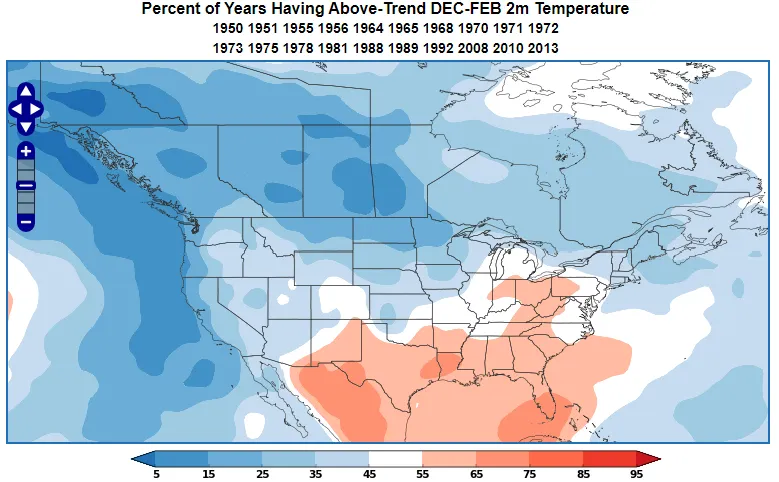
During the positive phase of the PNA in the wintertime, the Southern and Eastern US are more likely to see below normal temperatures, with above normal temperatures more likely in the West and Northwest (Figure 5).
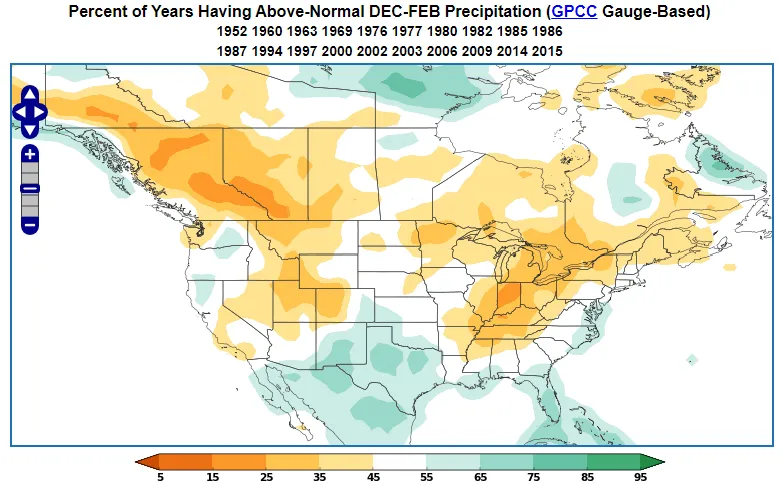
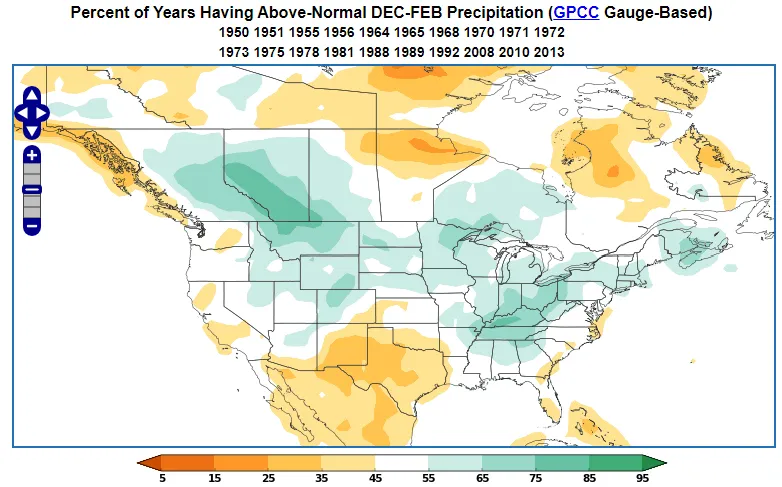
At the same time, the Northern Rockies and the Midwest are likely to be drier than normal, while Texas, the Gulf states, and the East are likely to be wetter than normal (Figure 6).
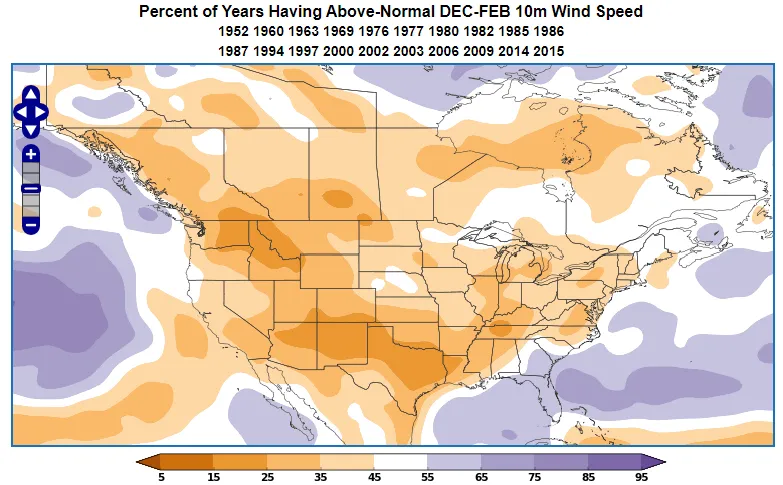
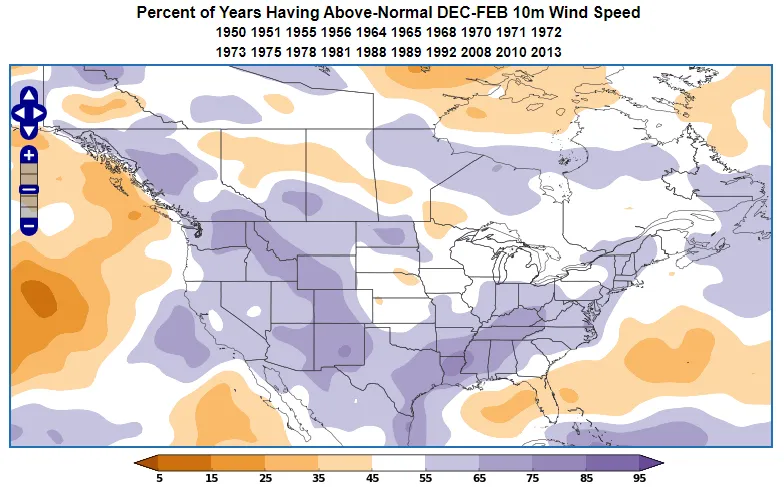
The positive phase of the PNA also favors low wind during the winter (Figure 7).
When we see a strongly positive Pacific-North American pattern in winter, then the anomalies are similar to those shown in Figures 5, 6, and 7, with the exception of temperature, where the expanse of above normal extends more into the Southern Plains and the Midwest.
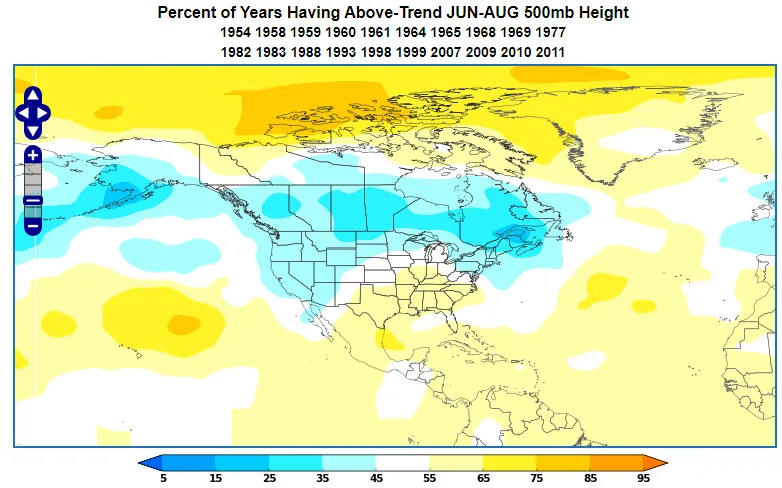
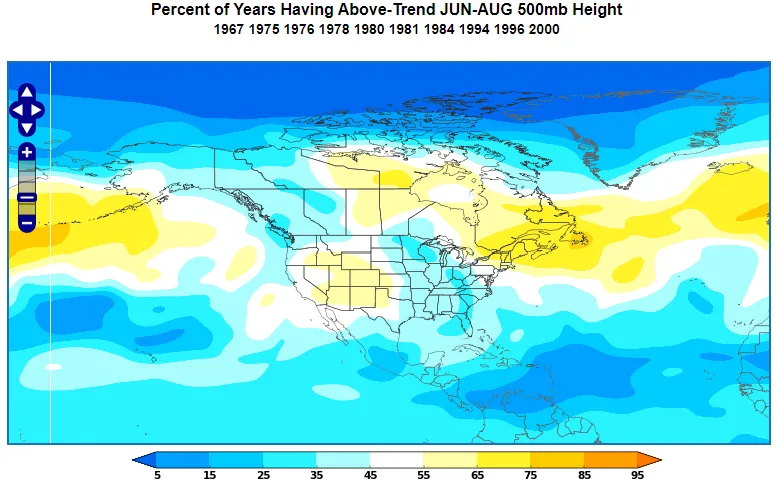
Summer PNA Index– Strongly Positive
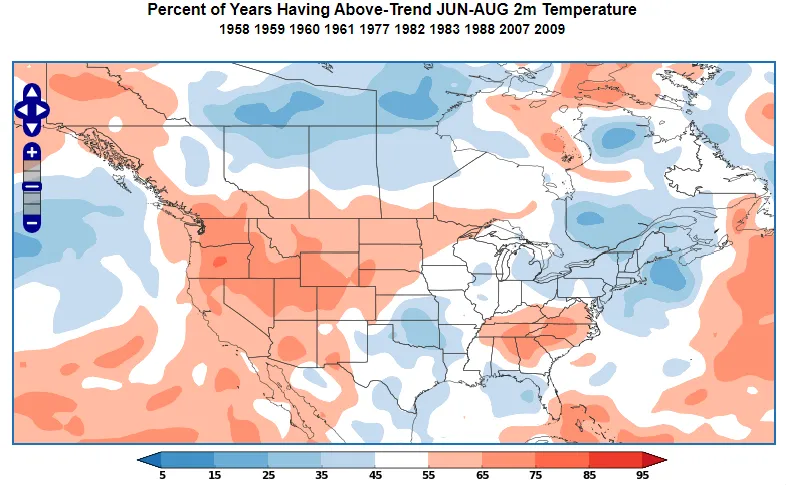
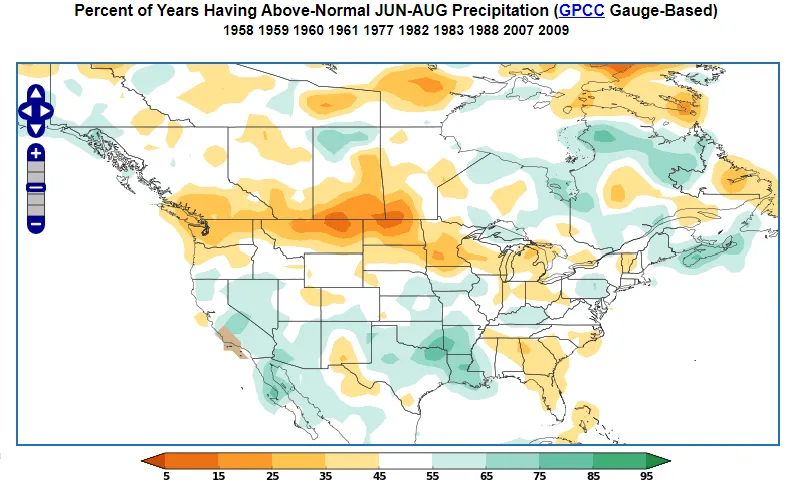
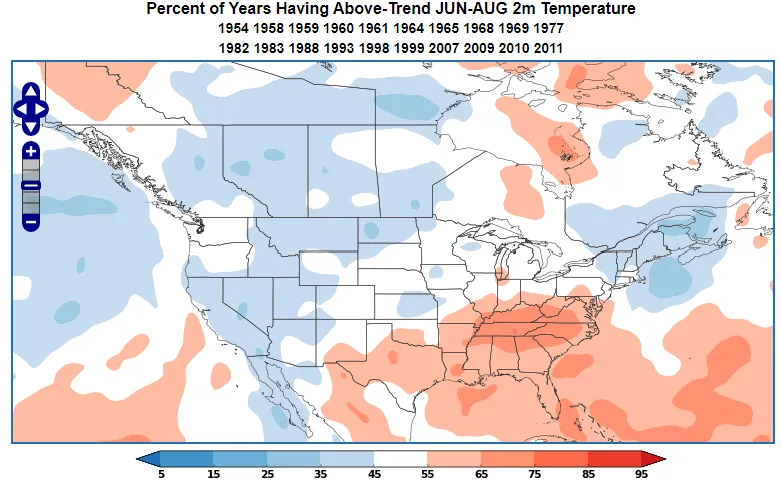
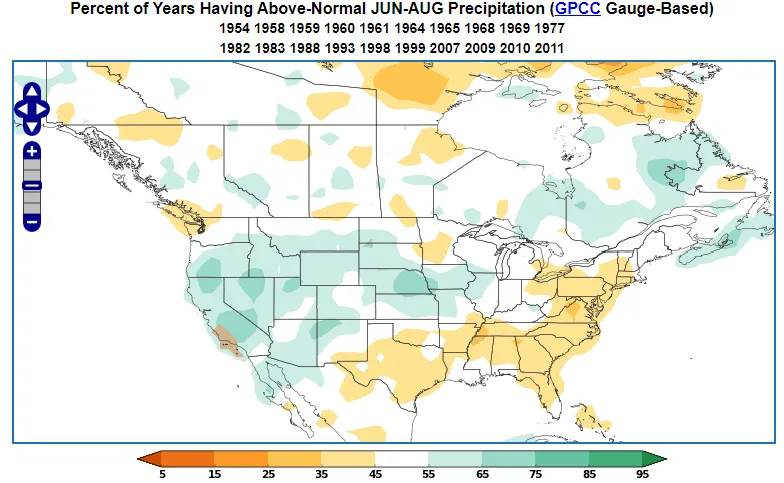
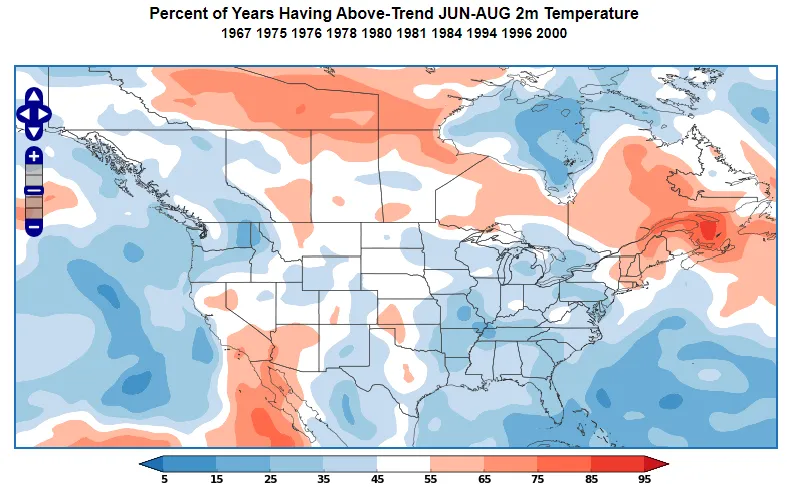
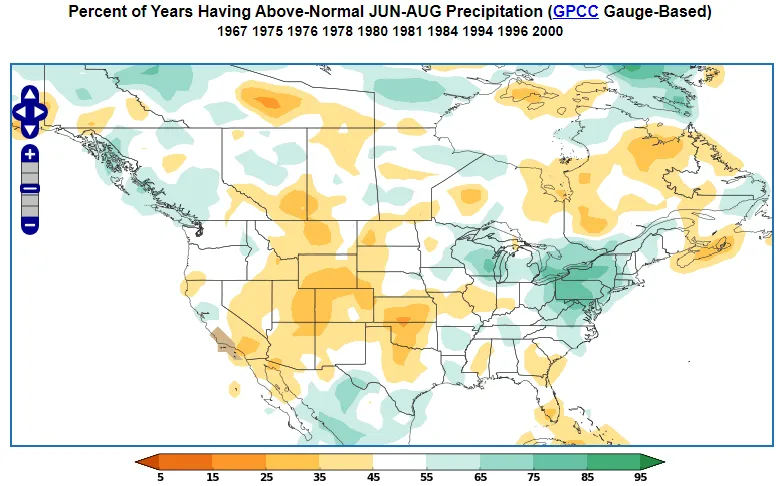
In summertime the strength of the positive PNA is crucial. When the summer PNA is strongly positive we see warmth in the West and the Southeast with below normal for South Central and the Northeast (Figure 8). At the same time we see a dry zone from the Pacific NW to the Midwest, as well as over the Southeast (Figure 9). The South and the Southwest are typically wetter than normal, as is the Northeast.
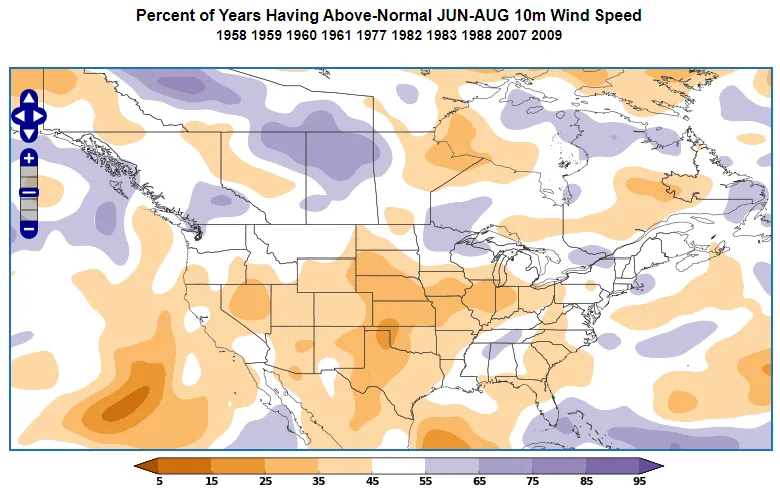
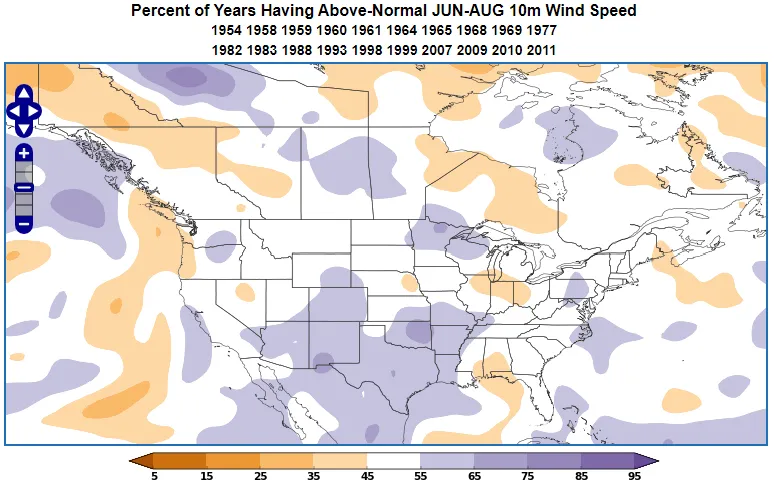
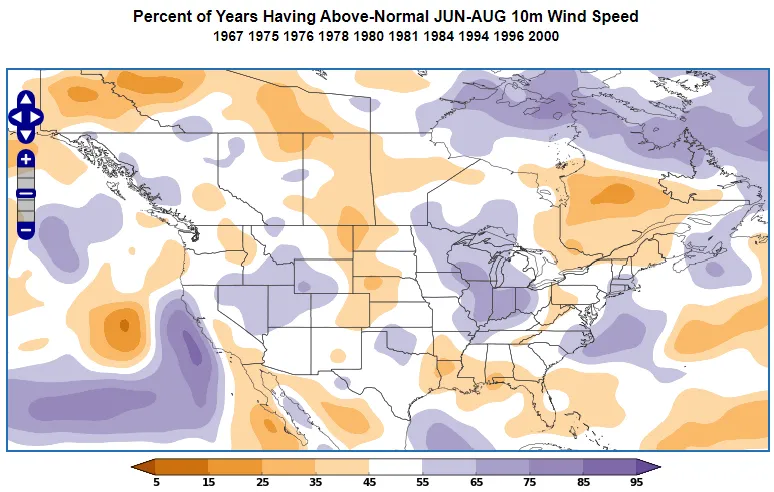
The strongly positive phase of the PNA also favors low wind during the summer (Figure 10).
Summer PNA Index – Moderately Positive
When the summer PNA is only moderately positive we see a mirror of the strongly positive summer pattern. Heat is felt across the South and Southeast, while other areas are more likely to be cool, particularly in the West and Northeast (Figure 11). Rainfall is likely to exceed normal over the Plains and the West, while the South and East is more likely to be drier than normal (Figure 12).
The moderately positive phase of the PNA tips the balance in favor of stronger wind than normal (Figure 13).
Pacific-North American Pattern – Negative Phase
The negative phase of the PNA is more or less a mirror image of the positive phase, with high pressure centred on the Aleutians and low pressure towards Hawaii (Figure 14). We see strong troughing over Western Canada, ridging over the Southern US, but also troughing over the Northeastern US.
In the summer there is a slight preference for ridging over the Southwest and New England, but troughing is typical in the Central and Southeastern US (Figure 15). In the case of the negative phase, there is not a huge difference between strong and moderate phases. The main difference being that a negative PNA that is only moderately so, is less likely to bring troughing to the Midwest.
Pacific-North American Pattern – Negative Phase Impacts
Winter
During the negative phase of the PNA in wintertime, the Southern US is more likely to see above normal temperatures, with below normal temperatures more likely in the North and West (Figure 16). At the same time, the Northern Rockies and the Midwest are likely to be wetter than normal, while Texas, the Gulf states, and the East are likely to be drier than normal (Figure 17).
The negative phase of the PNA in winter also favors high wind during the winter.
Summer
In summertime when the PNA is negative we see cooler than normal across much of the South and East, as well as the Pacific NW (Figure 19). At the same time, we are more likely to see above normal across New England and the far Southwest. In terms of rainfall, the negative Pacific-North American Pattern is likely to bring anomalous rainfall to much of the East, especially the Northeast, while the West is liable to be drier than normal, particularly over the Great Plains (Figure 20). Note the Midwest is more likely to be wet during a strong negative phase than a moderately negative phase.
The negative phase of the PNA brings a mixed picture for anomalous wind in summer.
World Climate Service provides a powerful data mining tool which enables users to quickly explore the Pacific-North American pattern, and many other indices, by phase for each month of the year, showing impacts on all the major weather variables right around the globe.
PNA Index Forecast
Forecasts of the PNA pattern help meteorologist understand what the broad scale pattern is going to in the future. An example PNA forecast from the ECMWF Extended model is shown below.
Pacific-North American Pattern – Long-Range Forecasting
The Pacific-North American pattern typically remains in a given phase anywhere from a few days, to a few weeks, and has a reputation for being unpredictable. One of the reasons for this is that the PNA is modulated by the tropical Madden-Julian Oscillation, which has an irregular 42-day cycle.
Thus the PNA is very much a subseasonal climate index (as opposed to a longer-lasting seasonal climate index such as ENSO). Occasionally the subseasonal models will latch on to a high probability of one phase or the other with a 2 or 3 week lead time. If we see cross-model support, then we can start to think about what typically happens for that phase of the PNA at this time of year.
As we have discussed, some caution is needed when we see a positive Pacific-North American pattern in summer, as the distribution of weather impacts are very much determined by the strength of the positive anomaly.
Pacific-North American Pattern – Conclusion
The Pacific-North American pattern is a measure of the relative strength of the Aleutian Low which influences the pattern downstream across much of North America. The PNA is a subseasonal phenomenon which is relatively choppy and rarely persists in one phase for more than a week or two.
The Pacific-North American pattern is an important consideration in subseasonal forecasting as it displays characteristic weather patterns over the lower 48 which change with the time of year.