Weather Forecast Calibration: Introduction
You are a meteorologist supporting energy trading desks. You know exactly when each weather model updates because your traders always need the latest forecast weather information. You likely watch the live feed as the latest forecast run comes in. You note how the forecast has changed, and how it compares to normal, while factoring that information into your trading until the next update arrives six to 12 hours later. But do you really know what the model is showing? How sure are you that you have taken away the correct message?
A friend of the World Climate Service, James Richards, worked on the Centrica trading desk for more than a decade. He quickly learned that one cannot always trust the colorful forecast maps that appear on the screen. James tells us that not all model displays are not born equal. In fact, the same forecast model run can look very different depending on how it is processed and where it is displayed. In some cases, the same forecast can be presented with different anomalies, which means the data you rely on could be downright misleading.
We highlight four ways in which all may not be as it seems . . .
#1: Forecast Calibration – Weather Forecast Biases
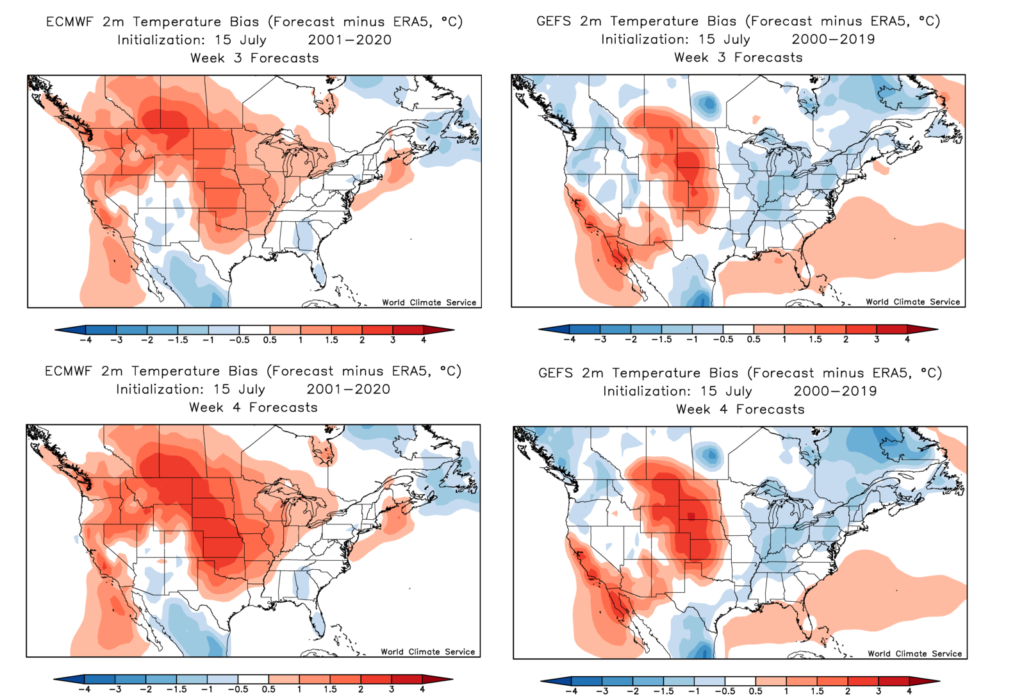
We all know that global forecasting centers, such as the ECMWF in Berkshire, England, operate at the bleeding edge of weather modeling and computing science. So, you’d be forgiven for thinking that all of their model output is perfectly consistent. It is not. In fact, despite the best efforts of ECMWF, many forecast variables have biases – which means the forecasted average for a particular variable, such as temperature or precipitation, does not match the average conditions in the real world.
These biases occur in all weather variables and are dependent on multiple factors; the model, the location, the forecast lead time, and the time of year. Effectively eliminating bias requires precise statistical evaluation of the data after the forecast is created, called post-processing. Post-processing is not quick or easy, but scientists at the World Climate Service apply post-processing to every WCS forecast to ensure the model output is as trustworthy and reliable as possible.

Correcting the forecasts for bias requires recalculating the adjustment for every new forecast. For example, when the ECMWF releases a new long-range forecast, they also provide 20 years of reforecasts for the same period in the past. This set of forecasts is processed to calculate the required bias correction.
Scientists at the World Climate Service have been bias-correcting model output for more than 15 years, meaning when you view a WCS product, you can have complete confidence that the forecast displayed is a true reflection of the model output.

#2: Forecast Calibration and Forecast Ensemble Under/Over Dispersion
Another way in which uncorrected forecast information leads users down the wrong path is under (or over) dispersion This concerns the range or spread of the numerous forecasts produced by an ensemble forecast model.
Ideally, the spread in the ensemble model forecast, (which indicates the uncertainty of the forecast), matches the variability of conditions we see in reality. But, unfortunately, it rarely does. For example, the historic spread in maximum temperature recorded in Houston in July could be 45 °F, but the model may only be able to produce a range of 35 °F (under dispersed). This deficiency means the model is unable to capture the uncertainty of each long-range forecast adequately.
To properly capture forecast uncertainty and make the output more realistic, corrections are applied to the forecast uncertainty via a process called calibration. Forecast calibration modifies the range of each ensemble forecast to properly represent the variability of the forecasts relative to weather and climate observations. World Climate Service scientists carefully apply the intricate statistical manipulation required to correct the under/over dispersion of each ensemble forecast.
#3: Forecast Calibration and Forecast Reliability
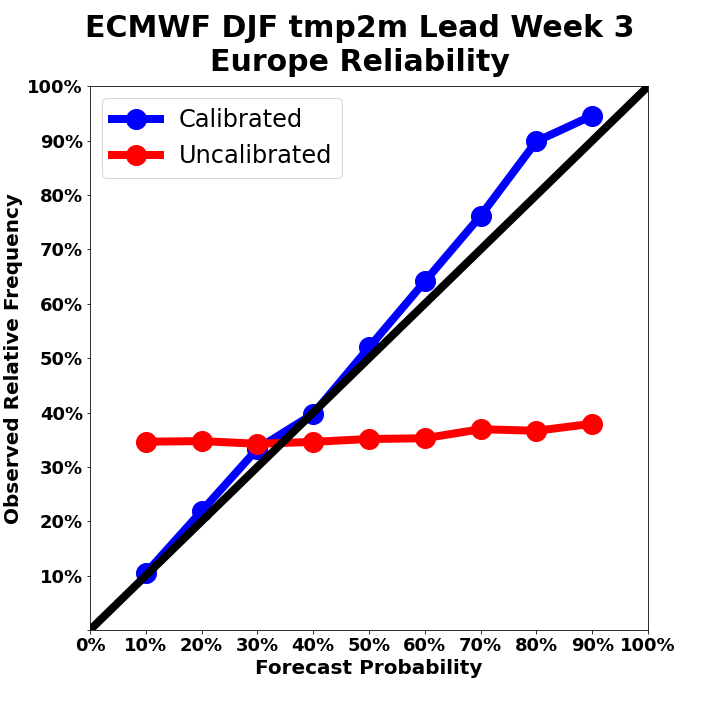
Weather forecast calibration fine tunes a probability forecast to ensure the forecasted event as frequently as the forecasted probability. When this occurs, the forecast is called reliable. A reliable probability forecast is one in which the event being forecast occurs at the same frequency as the probability of the forecast. In other words, if conditions three weeks from now are forecast to be wetter than normal with a 60 percent probability, a wetter than normal week should occur 60 percent of the time.
The reliability of a forecast is demonstrated using a reliability diagram. A reliability diagram compares the probability of a forecast to the frequency with which that event occurred. Figure 2 shows the benefit of forecast calibration of the ECMWF week three lead long-range temperature forecasts during December, January, and February over Europe.

In this example, we see that the ECMWF forecast observed frequency was always approximately 33 percent no matter the forecast probability. After applying the World Climate Service calibration method, however, the forecast becomes much more reliable. The observed conditions occurred as just frequently as the probability forecast suggested.
The benefit of forecast calibration is that long-range forecast users can estimate the risk of specific outcomes. For example, the forecast probability directly indicates the likelihood of a weather/climate event that is detrimental or positive to their business and, therefore, their profit and loss statements.
#4: Forecast Calibration and Climatology Considerations
Useful long-range forecasts are presented in terms of probabilities that inform the user of the chances of a specific event occurring in the future. For example, the World Climate Service forecast provides the probabilities of above normal, normal, or below normal conditions occurring.
As forecasts are presented as climate anomalies, (a measure of how conditions compare to normal), then the reference climatology is crucially important. For example, will it be warmer or cooler than normal? The magnitude, and even the direction, of the forecast anomaly, will be determined by the choice of climatology.
The climate has been warming rapidly over the last 60 years, which is why it is more important than ever that we rely on a climatology that is representative of today’s world. The traditional 30-year average can have a serious lag, which often makes temperature maps that reference a 30-day climatology look artificially warm, which can change the complexion of the forecast.
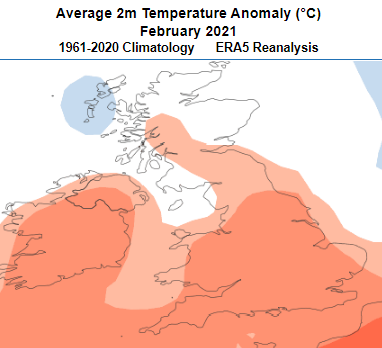
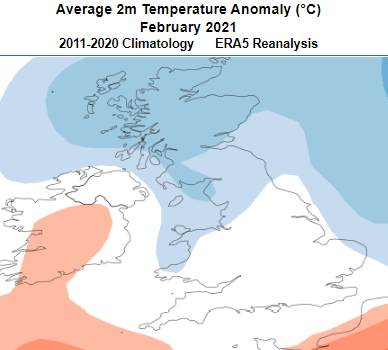
By way of example, let’s consider the temperatures in the UK during February 2021. Figure 3 and Figure 4 display exactly the same historical data, but the different reference climatology results in different interpretations of the temperature data relative to normal.


Clearly, the choice of climatology employed can change the message completely.
The same principle applies to forecast maps, which is why the World Climate Service presents forecasts with a choice of the latest climatologies; either the latest 20-year average or a trend-line normal (which extrapolates the 20-year trend forward to the current year).

Weather Forecast Calibration: The Power of Reliable Probability Forecasts
Every time the World Climate Service applies a weather forecast calibration, something magical happens. Not only do the probability maps reflect the model forecast’s true information, but they also enable the production of reliable probability forecasts. Reliable probability forecasts enable users to know precisely how likely a forecast event is to occur, even with lead times of six weeks ahead. This characteristic enables users to evaluate the risk of specific outcomes because the probability of the event is known in advance.
Weather Forecast Calibration: Conclusion
Weather forecast calibration is crucial because without it the forecast that you see will at best be slightly inaccurate, and at worst, could be downright misleading – the sign of the anomaly could even be wrong. Forecast calibration allows users to properly assess the risk of positive or detrimental outcomes to their business from future weather and climate events.
If you cannot vouch for the integrity of your forecast display, then gain an edge on the market by placing your trust in the World Climate Service, where seeing really is believing.