ABNA and ERCOT HDD Risk: Implications for ERCOT Power and Natural Gas Desks?
A common assumption on ERCOT power and natural gas desks is that ENSO, the El Niño Southern Oscillation, is the primary large-scale climate signal for winter demand risk. This analysis points in a different direction. When the Asian-Bering-North American climate index, ABNA, and ENSO are compared against ERCOT population-weighted HDDs, ABNA exhibits a more pronounced inverse winter relationship, especially in December through February, with the signal extending into November and weakening somewhat by March.
As shown in Figure 1, the relationship between ABNA and ERCOT HDDs is characterized by a steeper negative slope than the relationship between ENSO and ERCOT HDDs during the core winter months. Figure 2 shows that the same general pattern remains in place when HDD deviations from climatology are used, which helps reduce the influence of the seasonal cycle and provides a cleaner view of the signal.
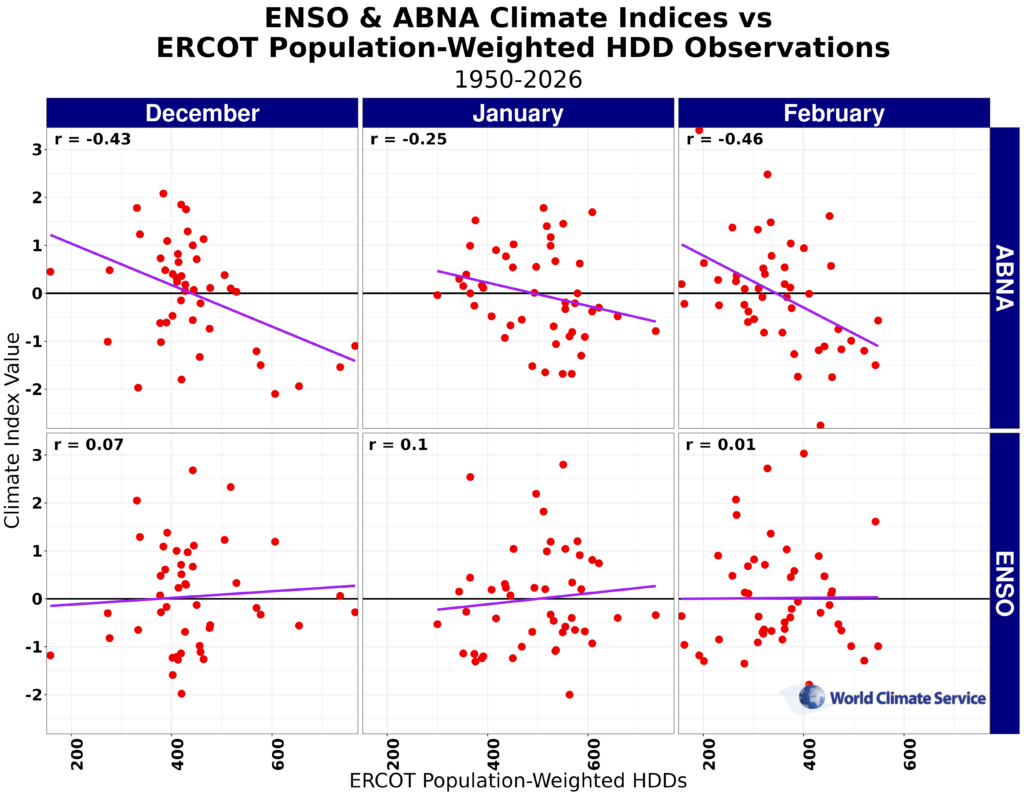
Figure 1. ENSO (MEI) ABNA climate indices vs ERCOT population-weighted HDD observations for DJF.
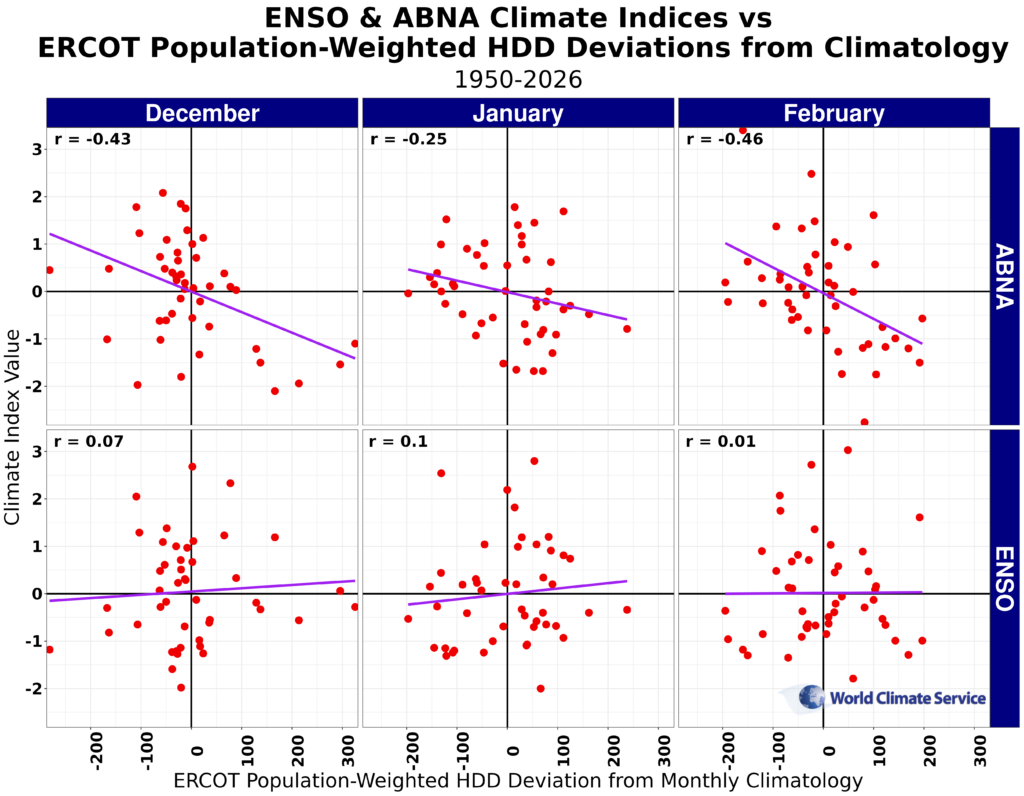
Figure 2. ENSO (MEI) ABNA climate indices vs ERCOT population-weighted HDD deviation from climatology observations for DJF.
What is the ABNA Climate Index?
The ABNA Climate Index, or Asian-Bering-North American index, measures a large-scale atmospheric teleconnection pattern in the 500-hPa geopotential height field that extends from North Asia across the Bering region into North America. It is strongest in winter and is important because it strongly influences North American temperature variability and temperature extremes, including both unusual warmth and unusual cold. For more information on the ABNA Climate Index, visit our blog post on What is the ABNA Climate Index.
What the ABNA/HDD Relationship Means for Power Desks?
ABNA appears to be a more informative large-scale signal than ENSO for assessing baseline ERCOT winter HDD risk. That makes it especially useful for energy meteorologists and power traders who need to evaluate whether winter demand risk leans warmer or colder at the ISO level.
The ABNA-to-HDD relationship can also improve analog selection and provide better context for winter-demand scenarios. When ENSO does not offer a clear or consistent signal, ABNA may provide a more reliable large-scale backdrop for interpreting ERCOT’s heating-demand risk.

Why is the ABNA Index Analysis Significant?
The monthly comparison of ABNA and ENSO against ERCOT population-weighted HDD observations indicates a more pronounced inverse relationship for ABNA during December, January, and February. As shown in Figure 1, ABNA exhibits a steeper negative slope than ENSO during the most important months for heating demand.
That inverse relationship carries direct implications for demand and PnL for ERCOT’s power desks. Positive ABNA index values generally align with negative HDD deviations from climatology, which favors below-normal heating demand and can reduce weather-driven upside risk to gas consumption and power load. Negative ABNA index values generally align with positive HDD deviations from climatology, which favors above-normal heating demand and can increase weather-driven upside risk across natural gas and power markets.
That inverse relationship remains in place when the analysis is extended across the broader November through March heating season. Figure 3 shows that the ABNA signal is not limited to the heart of winter, although it weakens by March as seasonal HDD sensitivity declines.
Using HDD deviations from climatology supports the same conclusion. As shown in Figure 2 and Figure 4, ABNA continues to exhibit a more pronounced inverse relationship than ENSO even when the analysis focuses on HDD anomalies rather than raw HDD values. This helps confirm that the result is not simply a reflection of the annual cycle.
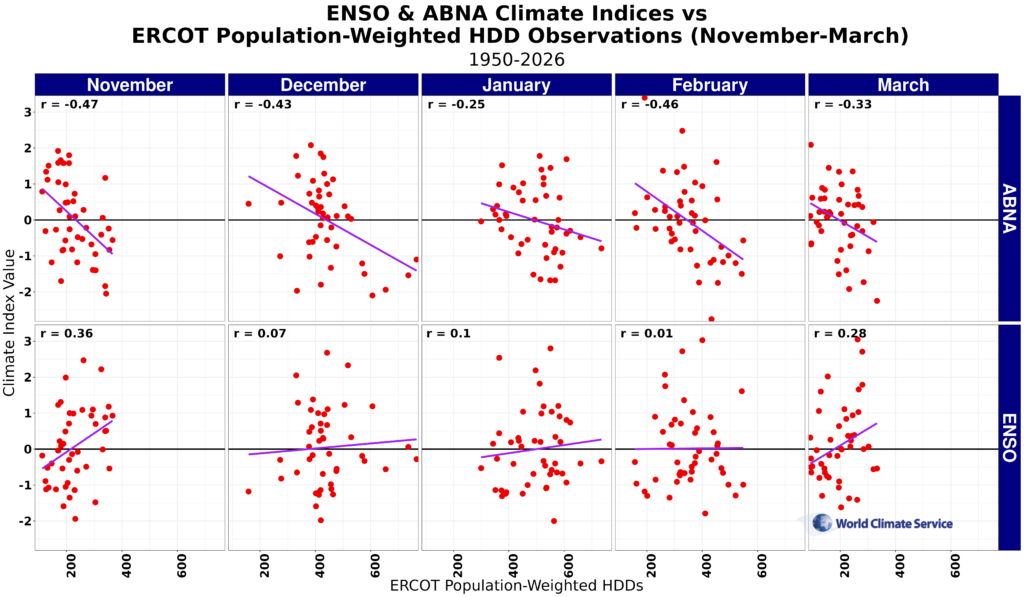
Figure 3. ENSO (MEI) ABNA climate indices vs ERCOT population-weighted HDD observations for NDJFM.
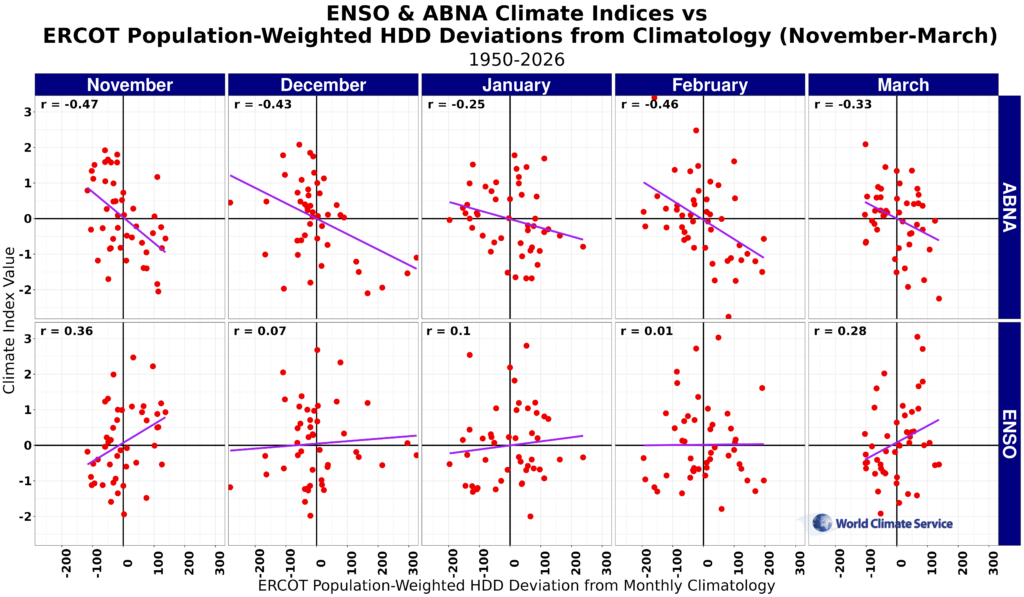
Figure 4. ENSO (MEI) ABNA climate indices vs ERCOT population-weighted HDD deviation from climatology observations for NDJFM.
Why does the ABNA Index Matter to Power and Natural gas Trading Desks?
For an energy meteorologist, the ABNA-to-HDD relationship provides a more useful large-scale demand signal when assessing whether weather risk is skewed toward below- or above-normal winter heating demand. If ABNA carries more winter demand information than ENSO at the ERCOT scale, then ABNA deserves greater weight in World Climate Service index analog selection, early-season demand narratives, and communication of baseline demand risk.
This does not create a stand-alone forecast. Instead, it helps establish the broader background state in which medium-range and subseasonal forecasts are interpreted. That can be valuable for desks that need to move quickly from climate signals to market-relevant demand expectations.
What ABNA Index Information is Included in the World Climate Service for Energy Meteorologists?
A practical workflow using the World Climate Service begins with monitoring the current observations and forecasts of the ABNA climate index. The next step is to use the Seasonal Climate Index Analogs tool to help validate whether the broader pattern supports below-normal or above-normal heating demand risk. The final step is to translate that signal into ERCOT and ISO-level degree-day risk for ERCOT power and natural gas markets. Watch how an energy meteorologist uses recent ABNA observations and WCS analog tools to assess CONUS winter HDD risk for power and natural gas markets.
The ABNA is a Guide: What this does not mean?
The ABNA climate index is not a replacement for well-researched monthly and seasonal forecasts prepared by an expert meteorologist. The index is best treated as a higher-level regime signal that helps a meteorologist establish the baseline and narrow the analog space before more detailed forecast decisions are made.

Conclusion
ABNA exhibits a more pronounced inverse relationship with ERCOT HDD risk than ENSO during the core winter season. As shown in Figure 1 through Figure 4, that relationship remains more evident across both raw HDD values and HDD departures from climatology. For ERCOT power and natural gas desks, ABNA is an important signal for winter demand-risk assessment, analog selection, and interpretation of the broader seasonal background state.
For desks focused on Texas power demand risk, see our CONUS version of this analysis to examine how ABNA compares with ENSO at the national level.
For desks that need a faster way to monitor climate indices, test analog years, and translate large-scale patterns into degree-day risk, the World Climate Service provides a direct workflow from index monitoring to market-relevant demand analysis.