NOAA Hurricane Forecast Skill: Introduction
Every year at the start of the North Atlantic hurricane season, numerous public and private entities issue seasonal forecasts of the expected level of tropical storm activity. Some, such as the Colorado State group and NOAA’s Climate Prediction Center, have been issuing these forecasts consistently for many years. It’s therefore an interesting exercise to look back and see how good the forecasts are. Do they have any skill? How often are they essentially correct? What shortcomings can be identified?
NOAA Hurricane Outlook: Category Forecasts
A comprehensive evaluation is well beyond the scope of this blog, but a few useful points can be uncovered by looking at the history of NOAA’s forecasts. Specifically, we’ll look at the early August forecasts of the probability of overall storm activity, categorized as “below-normal”, “near-normal”, or “above-normal”. The precise definition of these categories has changed over the years, but the history of the category definitions is available from the Climate Prediction Center along with the forecasts for the past 20 years.
The following table summarizes the August forecasts and subsequent verification history. Green shading indicates years when the probabilities correctly identified the category that verified, i.e. the most likely category in the forecast ended up being correct. Red shading indicates years with a two-category error (e.g. “below-normal” was most likely, but “above-normal” occurred).
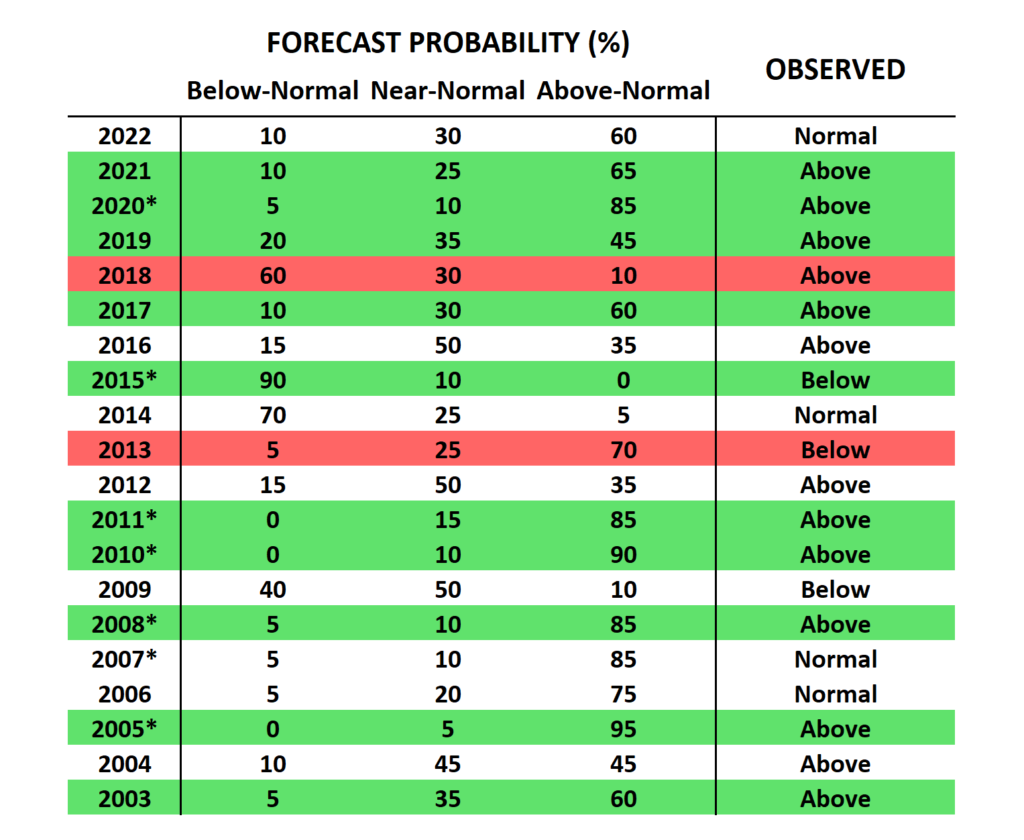
From a straightforward perspective, NOAA’s performance is clearly quite good: the category was correctly predicted 10 out of 20 times, or 50%. If the forecasts and observations were random, we would expect only 33% to be correct. Also, we would expect two-category errors in about 4 years if the performance were random, but in fact only 2 years were badly wrong.
Moreover, if we look at years with the most confident forecasts, indicated by an asterisk next to the year, we see that 6 out of 7 were correct. These are years with a forecast probability of at least 85% in one of the categories, and 86% of these forecasts were correct; this is a very good correspondence between forecast probability and observed frequency.
It’s interesting to observe, however, that the 20-year history was heavily biased towards above-normal storm activity (13 of 20 years), and 9 out of the 10 correct category forecasts verified as above-normal. Among the 7 years when NOAA did not show above-normal as the most likely category, only 1 forecast was correct (2015)! This means that all of the skill is in the above-normal category, and there is zero or negative skill when predicting below-normal or near-normal.
The high level of storm activity over the last 20 years also implies, of course, that naively predicting above-normal every year would have been a successful strategy, with a success rate of 65% – better than the actual forecasts issued by NOAA.
Forecast Reliability
This forecast data set also allows us to illustrate the concept of forecast reliability. This term has a specific technical meaning in the context of probabilistic forecasts: it refers to the correspondence between forecast probabilities and the frequency of the corresponding outcomes. For example, if NOAA indicates a 70% probability of an above-normal hurricane season, that outcome should occur 70% of the time on average. In some years with such forecasts, the season will be near-normal or even below-normal, but if the forecast is reliable, we should be able to count on above-normal happening with a 70% frequency.
A history of only 20 forecasts, as we have here, is too small to do a comprehensive assessment of forecast reliability, but nevertheless the “reliability diagram” shows an interesting result – see below. At the lower left we have the result for all forecast probabilities between 0 and 15%, for the below-normal and above-normal categories combined (near-normal is excluded here). There were 19 instances of 0-15% probabilities in above and below normal, and those categories ended up occurring in 2 of 19 cases, for a frequency of 11%. This is about right for a reliable forecast (i.e. the observed frequency is approximately equal to the forecast probability).
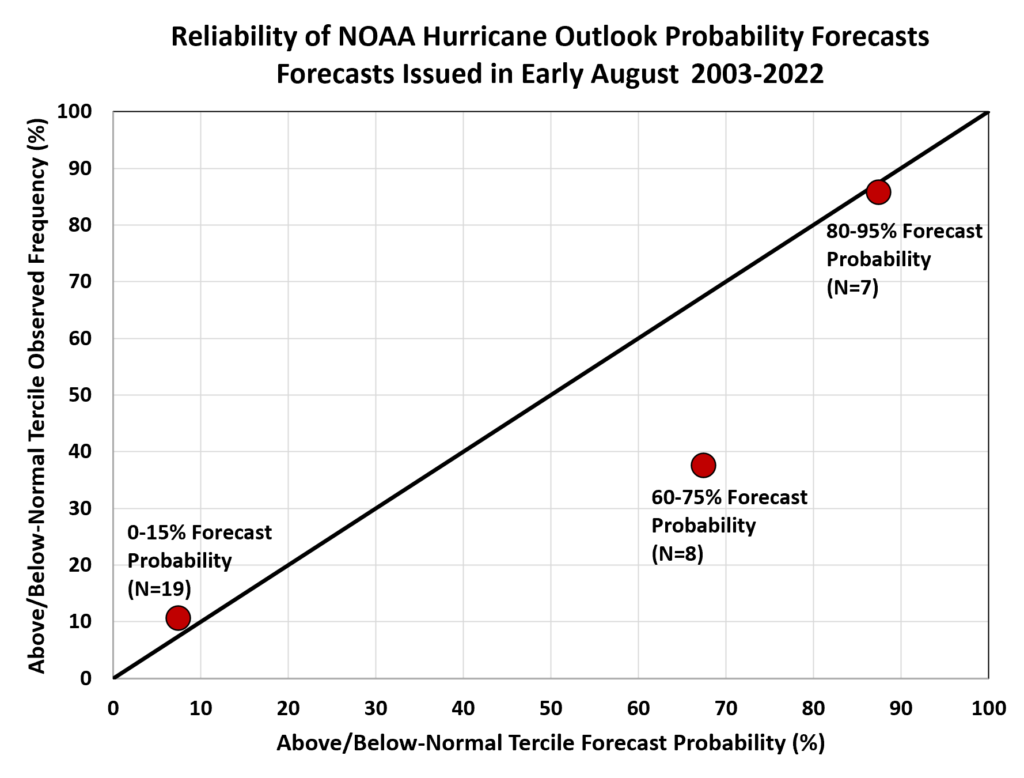
Conversely, at the upper right we see that there were 7 category forecasts with a probability of 80-95%, and these were correct in 6 of 7 cases, or 86% of the time. Again this is close to what it should be for a reliable forecast.
There are too few forecasts in the 20-55% probability range to attempt a comparison, but the 60-75% category has 8 forecasts; and only 3 of these (38%) ended up occurring. This is not reliable: the observed frequency is considerably lower than the forecast probability.
It would be unwise to draw any strong conclusions from a reliability analysis based on such a small sample, but it seems that we can make a tentative diagnosis of over-confidence for forecasts with probability near 60-70%. These are years when the signals aren’t strong enough to issue a highly confident forecast, but nevertheless the forecasters feel strongly enough to approximately double the chance of either the above or below normal category (i.e. 60-75% versus 33% random chance).
This season (2022) is a good example of a forecast with moderate confidence that was not successful in the end. The August 2022 NOAA hurricane outlook called for a 60% probability of above-normal activity, but in fact tropical cyclone activity was remarkably absent nearly all season except for an active September, and the season as a whole will end up in the near-normal category.
Potential for Hurricane Forecast Improvement?
How might the NOAA hurricane outlook be improved in light of this information about historical performance? In the first place, the NOAA forecasters shouldn’t change anything when the signals are strong enough to justify a very high probability (e.g. 80% or greater for the favored category, with 15% or less in the opposing category); these high-confidence forecasts have been very successful in the past.
However, it might be prudent to actively scale back the forecast probabilities in years when the signals aren’t strong enough to justify a very high probability. Based on the small sample examined here, there simply doesn’t seem to be skill in these less-unusual years; so unless the forecasters can justify a probability of at least 80%, they should probably hedge closer to equal chances for the 3 categories.
What would this mean for consumption of the NOAA hurricane outlooks and public confidence in the forecasts? If moderate-confidence signals are scaled back to low confidence, then in most years (perhaps 2 out of 3) the forecasts wouldn’t present any striking or actionable signals; this would be an admission that the majority of years are too difficult to predict with a robust level of confidence.
However, in the minority of years (perhaps 1 in 3) when a strong signal is evident, the message would be more compelling and potentially more actionable. With fewer “false alarms” in the moderate-confidence years, the value of the high-confidence forecasts would be easier to defend, and the obvious success in the high-confidence years would promote greater long-term public support for the forecasts.
The rise of machine learning in weather forecasting might also improve hurricane forecast skill in the coming years.