What is the ABNA Climate Index?
The ABNA Climate Index, or Asian-Bering-North American index, measures a large-scale atmospheric teleconnection pattern in the 500-hPa geopotential height field that extends from North Asia across the Bering region into North America (Yu et al., 2017). It is strongest in winter and it substantially influences North American temperature variability and temperature extremes, including both unusual warmth and unusual cold. This makes monitoring the ABNA climate index important for energy meteorologists.
In simple terms, the ABNA index describes a recurring upper-air 500-hPa height anomaly pattern that can significantly influence temperature patterns across North America. This pattern is linked to changes in upper-level pressure and geopotential heights, with key centers of action over North Asia, the Bering Sea region, and North America. For energy meteorologists on power and natural gas trading desks, the negative phase of the ABNA is especially important to monitor in winter because climate index analogs from the World Climate Service show below-normal temperature anomalies across much of the CONUS during this phase (Figure 1).
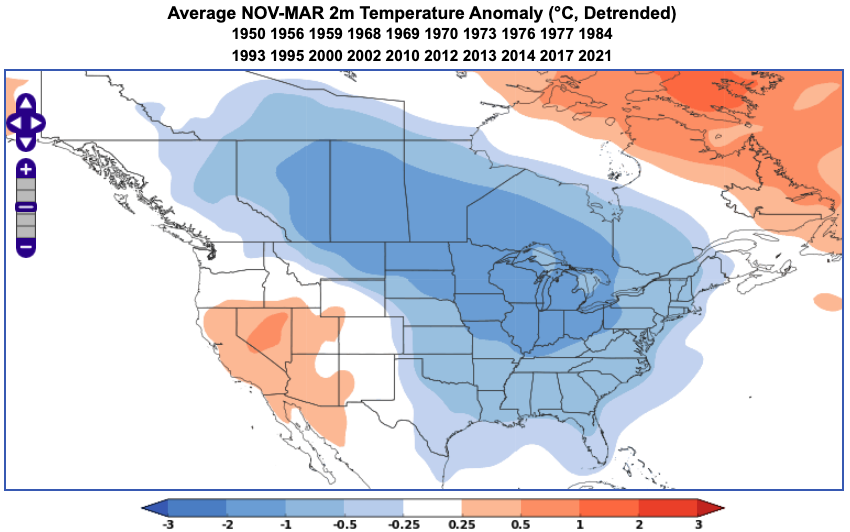
Figure 1. Average 2m temperature anomaly analog during a negative ABNA phase from November to March.

Positive ABNA
During a positive ABNA phase, a 500mb ridge tends to persist over the Pacific Ocean, while a trough is centered near Alaska (Figure 2).
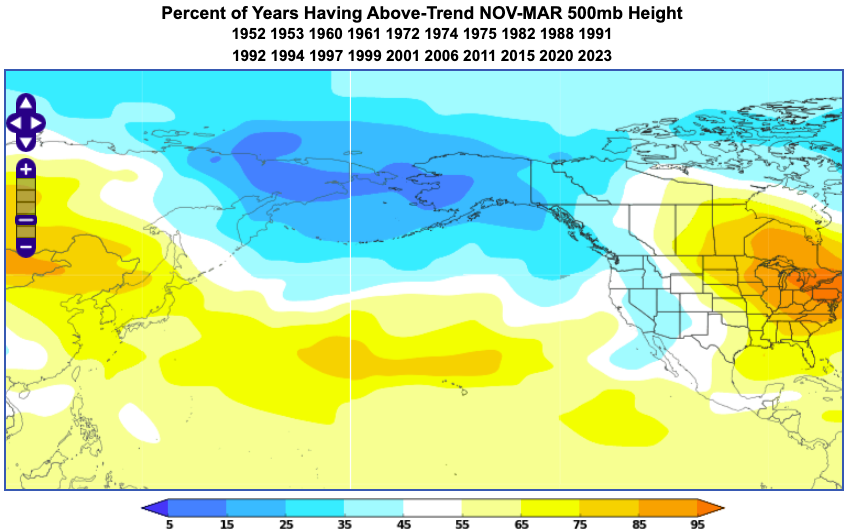
Figure 2. 500mb height analog during a positive ABNA phase from November through March.
A positive ABNA phase is generally associated with warmer-than-normal temperatures across parts of the central and eastern United States and much of Canada (Figure 3).
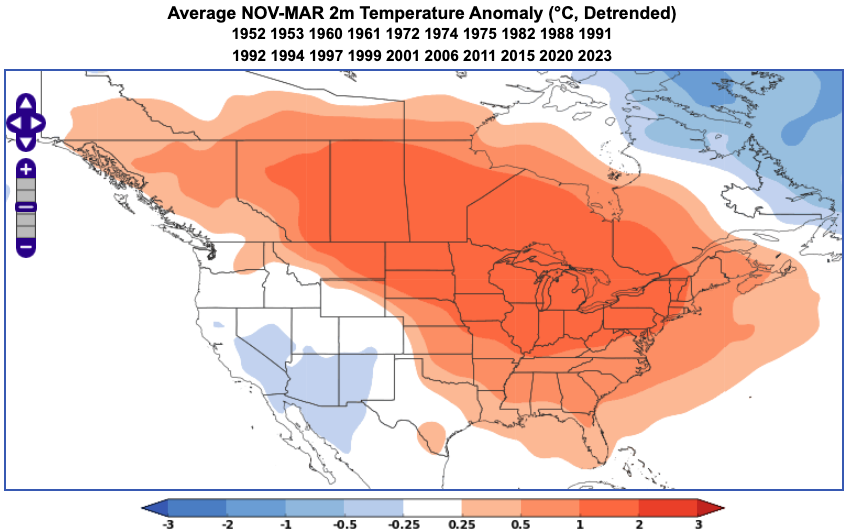
Figure 3. Average 2m temperature anomaly analog during a positive ABNA phase from November to March.
Negative ABNA
During a negative ABNA phase, the pattern reverses, with a 500mb trough tending to persist over the Pacific Ocean and a ridge centered near Alaska (Figure 4).
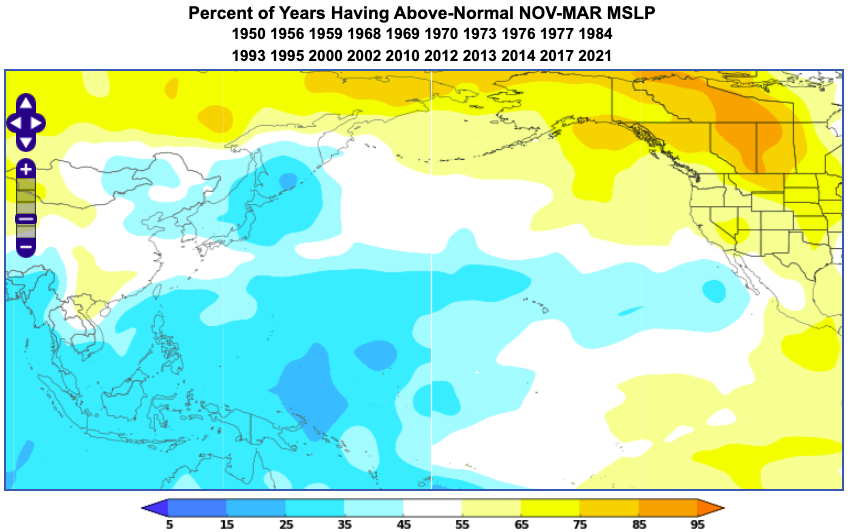
Figure 4. 500mb height analog during a negative ABNA phase from November through March.
A negative ABNA phase is generally associated with cooler-than-normal temperatures across parts of the central and eastern United States and much of Canada (Figure 1).
What Makes the ABNA Important to North American Climate?
ABNA is important because it helps explain North American temperature variability beyond more familiar climate signals such as ENSO. Published research shows that ABNA is a meaningful driver of North American temperature patterns and extremes, particularly during winter, and can explain a notable share of year-to-year temperature variability across the continent (Yu et al., 2017). For energy meteorologists and other weather-sensitive markets, the ABNA climate index is especially useful because it offers another large-scale signal to monitor when assessing temperature risk. In addition, World Climate Service research indicates that ABNA is more strongly related to CONUS and ERCOT heating degree days than ENSO (Figure 5a-b), based on comparisons with the Multivariate ENSO Index (MEI).
(a)
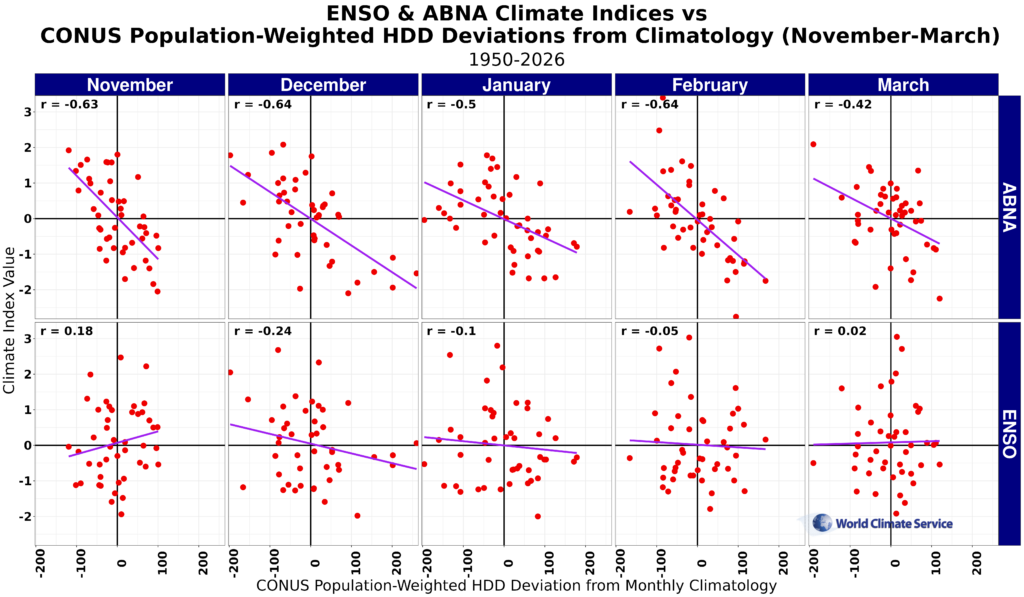
(b)
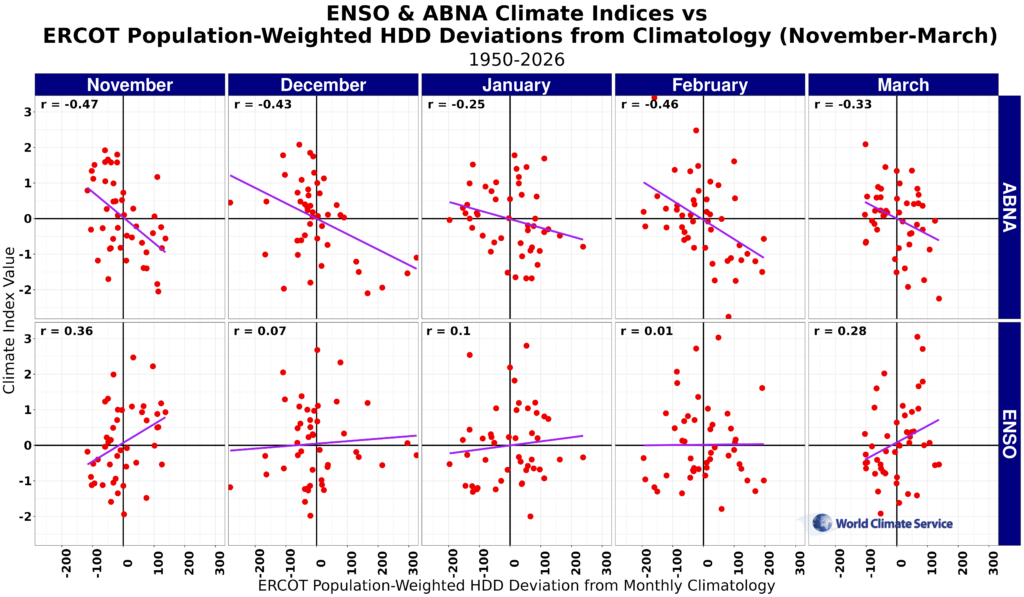
Figure 5. (a) ENSO & ABNA climate indices vs CONUS population-weighted HDD deviations from climatology for November through March. (b) ENSO & ABNA climate indices vs ERCOT population-weighted HDD deviations from climatology for November through March.

Conclusion
The ABNA climate index is a winter-focused atmospheric pattern that links North Asia, the Bering region, and North America. Because it strongly influences North American temperatures and temperature extremes, it is an important climate signal to monitor when evaluating broader temperature risk.