Henry Hub and Weather Forecasts: Spot Price Relationship?
Henry Hub natural gas daily spot prices react most significantly when forecast cold risk enters the market’s immediate trading window (Figure 1).
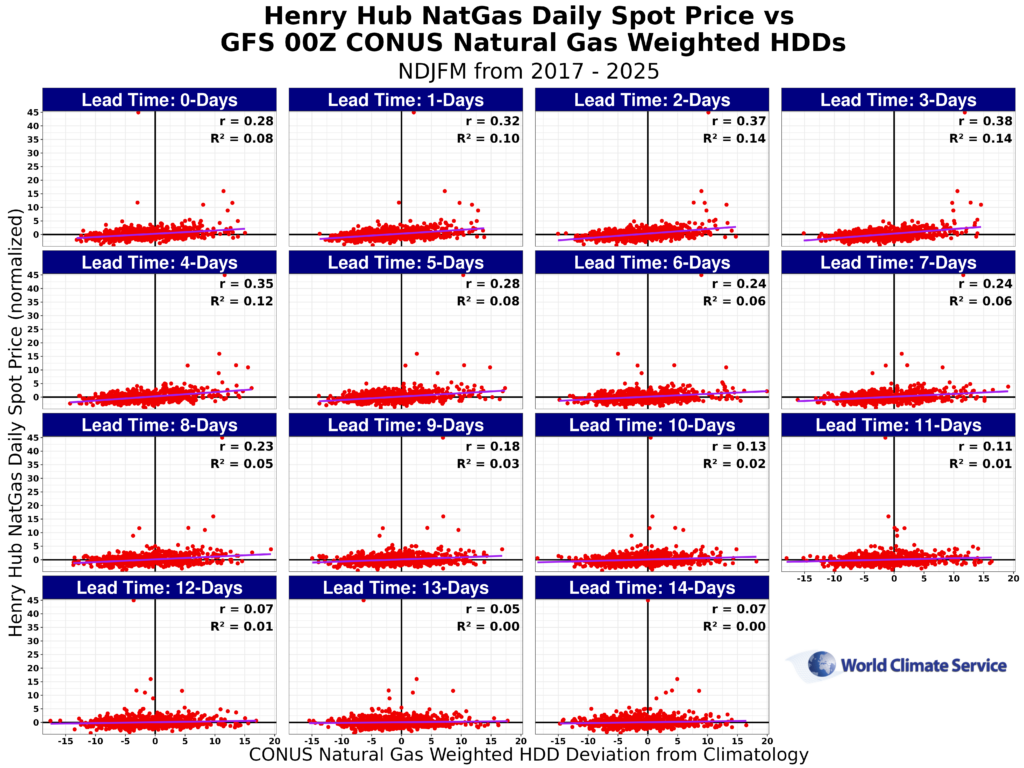
Figure 1. Henry Hub natural gas daily spot price vs GFS 00z CONUS natural gas weighted HDDs in NDJFM from 2017 – 2025.
Introduction
This case study evaluates the value of several years of archived CONUS natural gas consumption-weighted Heating Degree Day forecasts for Henry Hub natural gas price trading. The forecast archive is from the World Climate Service Point-in-Time Weather Forecast API. The analysis shows a measurable signal for Henry Hub natural gas daily spot-price volatility during the November through March (NDJFM) period between 2017 and 2025. Across the GFS, GEFS, and ECMWF 00z forecast models, the relationship is significant at roughly two to four days lead, while the signal weakens materially at longer lead times.
Henry Hub spot price vs. Weather Forecasts: The Relevant Question
The relevant question for energy meteorologists on U.S. natural gas and power trading desks is not whether colder weather is generally supportive for prices. The relevant question is at what forecast lead-time are Henry Hub spot prices most volatile and therefore have the greatest profitable trading opportunity. This can only be achieved by have access to a Point-in-Time weather forecast archive, giving an analyst access to a history of the forecasts released on specific prior days.
The analysis converts Henry Hub daily spot prices into a normalized Henry Hub spot-price index which is then compared to historical HDD deviation from climatology forecasts. The full-sample scatterplots, Figure 3, show a positive relationship between above-normal forecast HDDs and z larger departure of Henry Hub spot price from normal. The signal is significant in lead days two through four, where the fitted slope, correlation, and R² values are highest across the three forecast models shown in Figure 3a-c.
That distinction matters. The charts do not indicate that forecast HDD anomalies explain most day-to-day spot-price variation. They indicate that current-day Henry Hub spot prices are reacting to expected colder-than-normal conditions (i.e., greater than normal HDDs) forecast to occur several days into the future. The greater the deviation from normal that the cold conditions are forecast to be, the relevant to the immediate cash-market/physical spot market they are. This is confirmed by noticing that the largest outliers in the normalized Henry Hub spot-price index cluster around major cold-air outbreaks.
Calculations: How the Signal is Constructed
This case study compares Henry Hub’s daily spot-price abnormality with forecast CONUS natural gas-weighted Heating Degree Day anomalies from the World Climate Service Point-in-Time Weather Forecast API. Two calculated variables are central to the framework: a normalized Henry Hub spot-price index and forecast HDD values.
Henry Hub Spot Price Normalization
Henry Hub daily spot prices are converted into a normalized index to measure how unusual each daily price observation is relative to the preceding 30-day market environment.
The normalization is calculated as:
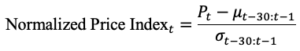
where:
- P_{t} is the Henry Hub daily spot price on day t
- \mu_{t-30:t-1} is the 30-day rolling mean of price calculated from the previous 30 days
- \sigma_{t-30:t-1} is the 30-day rolling standard deviation of price calculated from the previous 30 days
Using this approach, the daily price on day 30 is compared against the rolling mean and rolling standard deviation calculated from days 0 through 29. This structure compares today’s price against a benchmark distribution built only from prior days. A time series of the normalized Henry Hub spot-price index is shown in Figure 2.
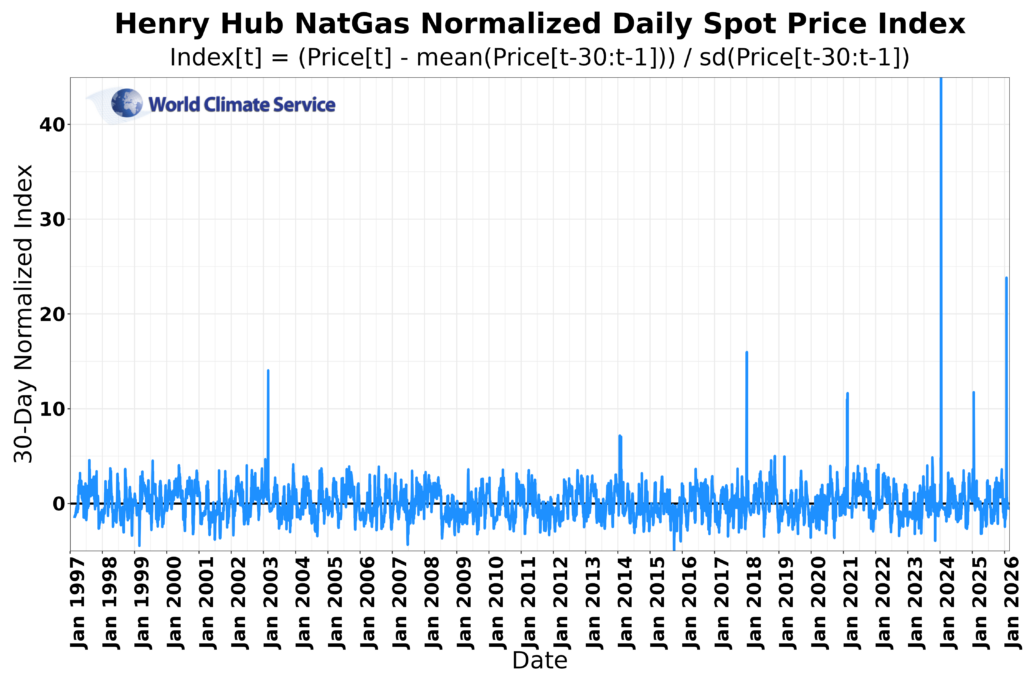
Figure 2. Henry Hub natural gas normalized daily spot price index timeseries.
Why the Price Series Is Lagged
The normalization uses prior days only, so today’s price is compared with a benchmark that exists before that day. Without the lag, the current day would be included in its own rolling mean and standard deviation, which creates look-ahead contamination and makes extreme moves appear less unusual than they actually are.
Why Normalize The Henry Hub Spot Prices?
The normalization measures whether Henry Hub spot prices are unusual relative to the recent market environment, not just whether prices are high or low in absolute terms. That matters because natural gas trades in very different price and volatility regimes over time. A normalized index makes different periods more comparable, helps identify extremes, and is more useful for signal detection because it separates the recent baseline from the size of the current deviation.
Heating Degree Day Calculation
Heating Degree Days are calculated using the standard formulation:
![]()
where T_{avg} is the average daily temperature.
Under this definition, HDD values increase as temperatures fall below 65°F, while days with average temperatures at or above 65°F receive an HDD value of zero. In this case study, those HDD values are aggregated into CONUS natural gas consumption weighted forecasts and expressed as deviations from climatology.
Using HDD anomalies rather than raw HDD totals makes it possible to evaluate whether forecast cold that is above normal or below normal relative to climatology aligns with stronger Henry Hub spot-price volatility.
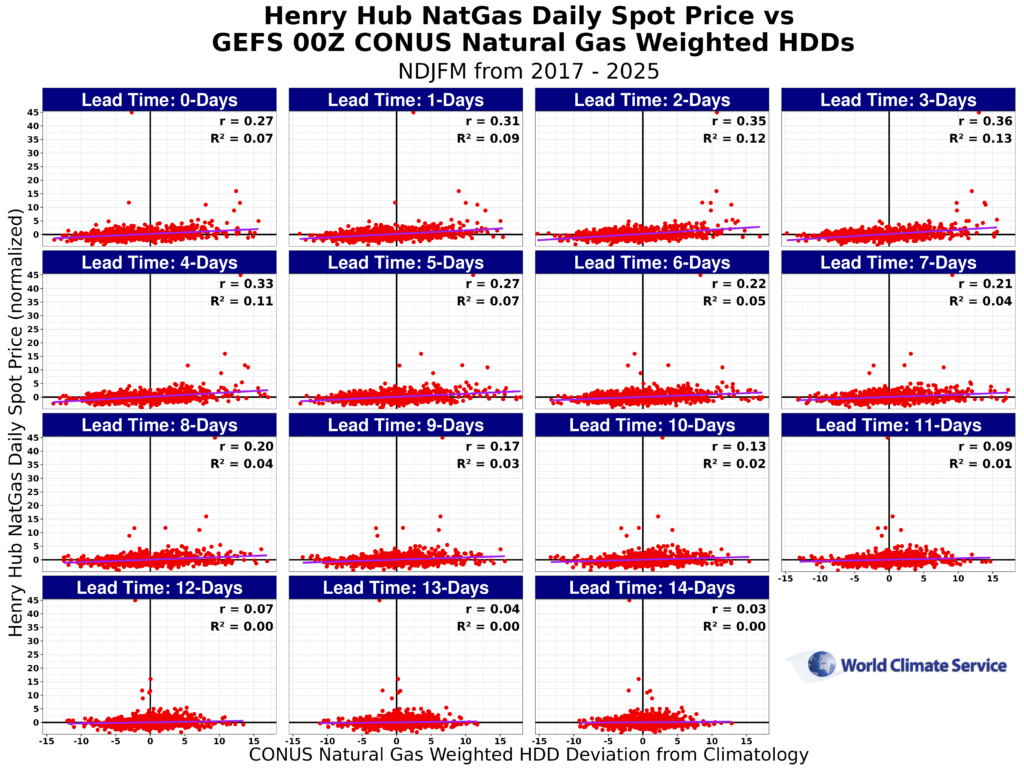
Henry Hub Spot Volatility Has Its Highest Weather Sensitivity at Two to Four Days Lead
Across the GFS, GEFS, and ECMWF graphics in Figure 3a-c, the same broad pattern appears. The relationship between CONUS natural gas consumption weighted HDD anomalies and the normalized Henry Hub spot-price index is positive at short lead times, significant around two to four days lead, and progressively weaker beyond roughly five to seven days.
That pattern is consistent across all three weather forecast models. In practical terms, it indicates that the market response is most sensitive when forecast cold moves from background information into the near-term physical trading window. By contrast, the relationship is much weaker at 10 to 14 days lead, where the fitted lines flatten and the explanatory power approaches zero in each panel.
That timing profile matters on a U.S. gas or power trading desk. The 2-to-4-day lead window is the highest-sensitivity period. At that point, forecast cold is close to delivery, near-term demand risk is more visible, and the potential for operational or physical-market stress becomes more relevant to cash pricing.
For an energy meteorologist, this is the window where forecast updates deserve the most attention when the objective is to translate forecast information into Henry Hub spot-risk context, physical balancing risk, and short-term exposure management. For a natural gas or power trader, this is the lead window where forecast cold is most likely to shift from directional weather information into an actionable cash-market input.
(a)
(b)
(c)
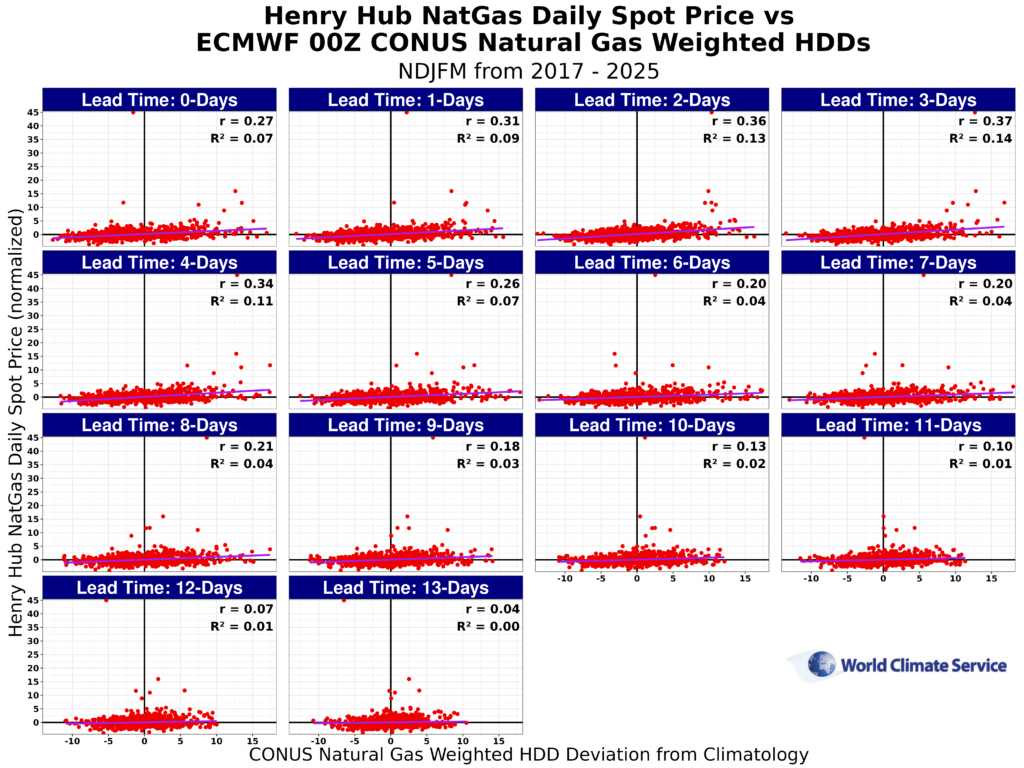
Figure 3. Henry Hub natural gas normalized daily spot price index vs GFS 00z CONUS natural gas weighted HDD forecast: (a) GFS 00z, (b) GEFS 00z, and (c) ECMWF 00z.
Major Cold Events Dominate the Largest Henry Hub Spot-Price Moves
To better understand the upper tail of the distribution of Henry Hub normalized spot prices, the annotated figures isolate the dates associated with the larger normalized price observations in Figure 5. Using a threshold of eight on the normalized Henry Hub spot-price index, the following initialization dates appear:
- 2018-01-02
- 2021-02-11
- 2021-02-16
- 2021-02-17
- 2024-01-12
- 2025-01-17
These dates are not random. Each date falls within, or immediately ahead of, a significant U.S. cold-air outbreak window.
Figure 4. Henry Hub natural gas normalized daily spot price index vs ECMWF 00z CONUS natural gas weighted HDD forecast with cold event initialization dates shown.
January 2018: New Year Arctic Outbreak
In the annotated graphic in Figure 5, 2018-01-02 appears among the higher normalized price observations at short and intermediate leads. That positioning is consistent with a market environment in which forecast cold is already moving into a near-term pricing window.
For a trading desk, this setup highlights a recurring pattern: once a major cold event moves into the immediate forecast horizon, Henry Hub spot prices become more sensitive to HDD risk than they are at longer lead times.
February 2021: Extreme Cold, ERCOT Stress, and Gas Supply Disruption
The 2021 event cluster shown in Figure 5 is especially important because it includes three separate initialization dates: 2021-02-11, 2021-02-16, and 2021-02-17. These dates sit within the February 2021 severe cold event that affects Texas and much of the southern United States.
The ERCOT natural gas weighted HDD observations graphic in Figure 6 aligns with the severe cold event window. ERCOT HDD departures from climatology rise sharply beginning February 9th and peak near 40 HDDs above normal on February 15th. That pattern indicates not only a cold event, but also an exceptionally anomalous one in a critical natural gas and power market region.
The event combines extreme HDD anomalies, intense regional demand stress, natural gas supply disruption, and major power-system impacts. That combination is exactly the type of environment in which Henry Hub spot prices become highly sensitive to near-term weather risk.
For an energy meteorologist on a gas or power desk, the practical takeaway is that HDD anomalies alone are useful, but the highest-value signal emerges when above-normal HDD risk aligns with physical-system stress. For a trader, this is the type of setup where weather risk, fuel risk, and operational risk overlap. Figure 6 shows the ECMWF 00z ERCOT natural gas-weighted HDD forecast grids instead of CONUS.
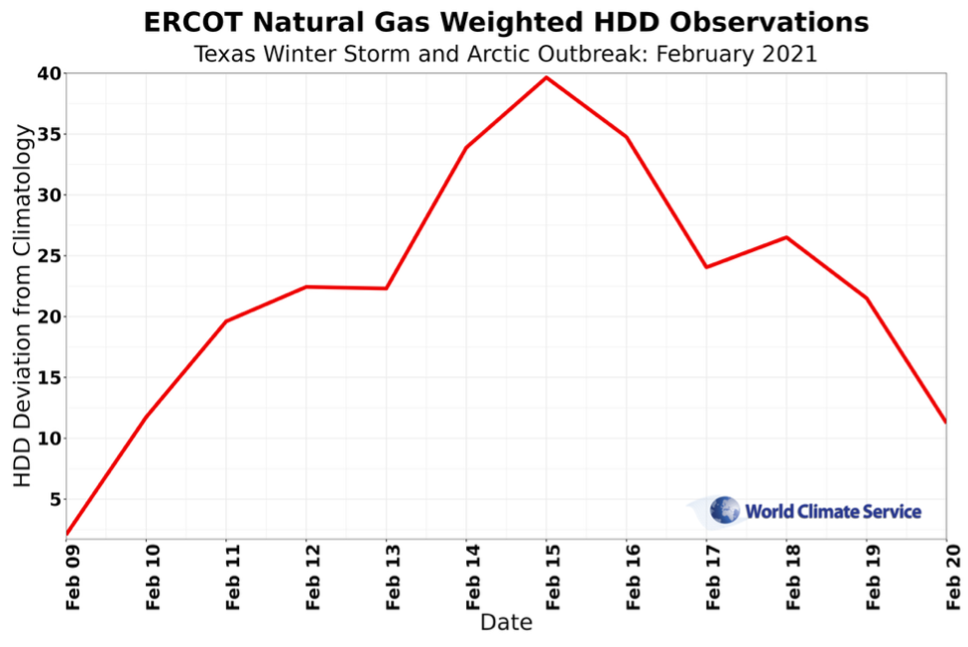
Figure 5. ERCOT natural gas weighted HDD observations during the Texas winter storm and arctic outbreak in February 2021.
Figure 6. Henry Hub natural gas normalized daily spot price index vs ECMWF 00z ERCOT natural gas weighted HDD forecast with initialization dates shown.
January 2024: When the Near-Term Cold Signal Becomes Extreme
The 2024-01-12 initialization date stands out as the most extreme normalized price observation in the annotated figures in Figure 4. In the ECMWF panel, 2024-01-12 is the dominant outlier in the Henry Hub distribution. At the same time, the model forecasts show that above-normal HDD risk is already emerging in the near-term forecast window.
This is exactly the kind of case study that matters to a U.S. natural gas trading desk. The event shows how a large-scale Arctic outbreak and a sharp Henry Hub price response align when forecast cold enters the immediate trading window. The signal is not distributed evenly across lead times. It intensifies when cold risk is close enough to affect prompt physical conditions.
For desk use, this type of event supports a practical workflow: monitor the 2-to-4-day lead window for escalating HDD anomalies, compare model agreement across GFS, GEFS, and ECMWF, and treat growing alignment as an indication that Henry Hub spot risk is becoming more actionable.
January 2025: The Market Prices the Cold Before Peak Impact
The 2025-01-17 initialization date functions more as a lead-in date than as the center of the outbreak itself. In the annotated figures in Figure 4, 2025-01-17 appears among the higher normalized price observations, especially in the short-to-intermediate lead windows where forecast HDD anomalies are most elevated.
This event reinforces an important market point: the substantial spot-price response does not require the coldest day to already be underway. In some cases, the sharper response emerges as the market prices the arrival of severe cold in the immediate forecast horizon.
For a desk workflow, that matters. The most valuable signal is often the transition from elevated forecast risk to imminent physical risk.
What These Event Clusters Show About Weather-Driven Henry Henry Hub Spot Risk
Taken together, the event dates support two conclusions.
First, the largest Henry Hub spot-price abnormalities are closely tied to major cold-air outbreaks. Monitoring the Point-in-Time weather forecast API real-time updated ensemble forecast data enables risk assessments of these outbreaks.
Second, those events are most visible in the scatterplots when forecast cold is located in the near-term lead window, especially two to four days ahead.
That does not mean forecast HDD anomalies provide a complete explanation for Henry Hub spot pricing. The full-sample R² values remain modest even in the strongest lead windows, which indicates that other variables still matter. Those variables likely include regional production risk, freeze-offs, storage conditions, deliverability constraints, LNG demand, calendar structure, and local or regional basis stress.
In other words, the forecast HDD anomalies provide a useful timing signal but not a complete spot-price model.
When does Forecast Cold Become Actionable?
The most significant practical takeaway from the figures is the timing profile. Across the full-sample charts (Figure 3a-c), the signal is most evident at two to four days lead. That is the period where the fitted lines are steepest, and the correlation metrics are more significant across GFS, GEFS, and ECMWF.
For an energy meteorologist or trading desk, that window matters because a forecast cold transition from a broad directional weather input becomes a more immediate cash-market risk factor. In other words, the signal is most substantial when the cold is close enough to delivery to matter for spot procurement, physical balancing, short-term generation planning, and near-term exposure management.
This is the trading application use-case of the case study:
- use a nine-year archive of point-in-time HDD forecasts to identify where weather begins to matter most for spot pricing,
- focus on the 2-to-4-day lead window as the highest-sensitivity period,
- watch for event clustering, model agreement, and increasing anomaly magnitude, and
- treat the largest signal as most meaningful when above-normal HDD risk aligns with physically stressful market conditions.
That workflow is relevant to both natural gas and power desks in the United States, especially where Henry Hub pricing, gas burn, regional load risk, and physical system constraints interact.
The Point-in-Time Weather Forecast Archive Advantage for Market Analysis: Testing the Signal the Market Actually Sees
A central advantage of this approach is the use of point-in-time forecast history rather than revised or backfilled data. For event analysis and strategy research, that distinction matters because it reduces hindsight bias and better reflects the information available to market participants when prices are set.
For a U.S. natural gas or power desk, the practical advantage is straightforward. The Point-in-Time Weather Forecast archive is not simply a record of old forecasts. It makes it possible to test whether a forecast signal is present at the time, how that signal evolves by lead day, and whether the market response concentrates in identifiable windows.
That is especially important for market users trying to separate true forecast signal from hindsight-based pattern fitting. In this case study, point-in-time forecast history makes it possible to evaluate what the market actually sees and when that information begins to matter most for Henry Hub spot-price abnormality.
Conclusion: Key Takeaways for U.S. Gas and Power Desks
This case study finds a clear but limited relationship between CONUS natural gas weighted HDD forecast anomalies and Henry Hub daily spot-price abnormality. Across GFS, GEFS, and ECMWF 00z forecasts from 2017 to 2025 only in NDJFM, the signal is most significant at roughly two to four days lead, and it weakens materially beyond that range.
The event studies reinforce the same conclusion. The largest normalized Henry Hub price observations concentrate around major cold-air outbreaks, including January 2018, February 2021, January 2024, and January 2025. In each case, the market faces either an ongoing or imminent period of materially above-normal cold, and in some instances that cold aligns with severe operational and fuel-supply stress.
The broader implication is practical. Henry Hub spot prices do not respond equally to all weather forecasts. They respond most sharply when forecast cold enters the immediate trading window, especially when that cold aligns with physically meaningful risk.
For U.S. natural gas and power trading desks, the use case is direct. Point-in-Time HDD forecast history helps identify when weather becomes actionable, when spot exposure becomes more sensitive to forecast updates, and when a forecast shifts from background information into a market-moving risk signal. That is where archived forecast data adds value: not by replacing market judgment, but by improving timing, improving context, and improving the ability to measure weather-driven risk as it develops.