Arctic temperature trends have become a topic of great interest and significance in the past two decades, as the Arctic has warmed much more rapidly than the rest of the globe, reflecting the phenomenon of “Arctic Amplification“. However, with relatively little ground-truth data available across the Arctic Ocean to monitor temperatures in a consistent way over time, uncertainty is quite high compared to the rest of the globe; even satellite measurements are difficult, because of the high latitude and extensive cloud cover. Consequently, scientific estimates of Arctic-wide temperature trends often lean heavily on computer models to diagnose conditions across the vast area, and these models bring their own errors and biases that complicate the problem.
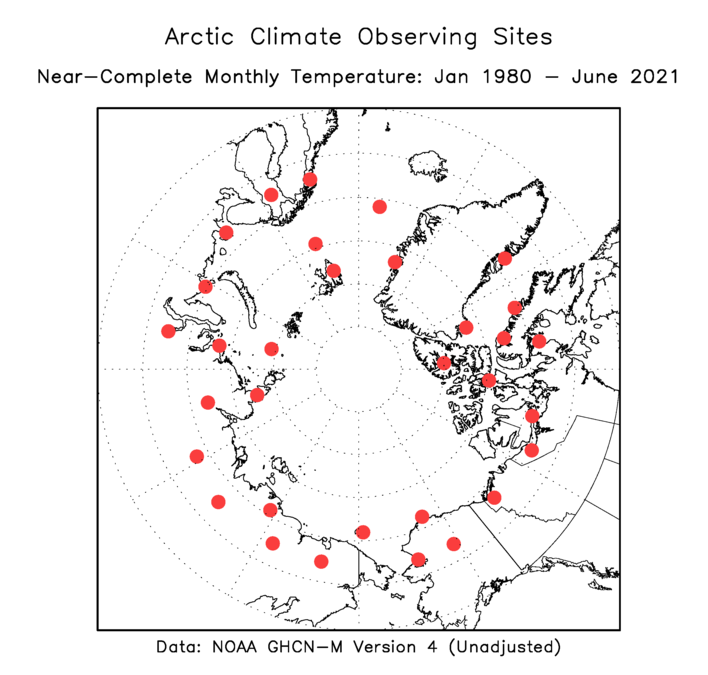
In light of the challenges, it is worth examining the temperature data from a fixed set of long-term climate observing stations around the Arctic. Using historical Arctic temperatures from NOAA’s GHCN-Monthly data set, we have identified 32 sites that are distributed quite evenly across the Arctic land areas; these sites have nearly complete data from 1980-2020 (no more than 3 years missing for any month), and all of them report reliably on a daily and monthly basis. Here’s a map of the sites; obviously they are confined to land locations, but they sample both coastal and inland low-elevation locations above the Arctic Circle.
Monthly Arctic Temperature Anomalies
With nearly complete data from each of these sites, it is straightforward to calculate the monthly climatological normal at each location (based on the 1991-2020 average) and then find the 32-site average of the monthly departures from normal. The chart below presents a multi-decadal view; the black line shows the 32-station average Arctic temperature anomaly, and the red and blue lines show the highest and lowest monthly anomalies within the set (with the largest anomalies occurring in winter, when variance is highest).
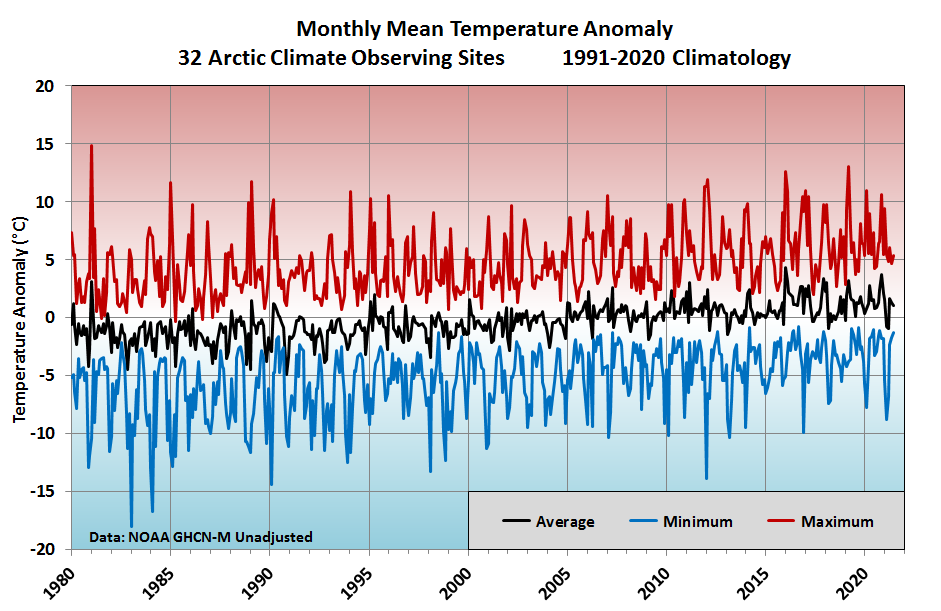
The overall warming trend amounts to +0.76°C per decade (using simple linear regression), or a little over +3°C in the 41-year period. This is much more warming than has occurred across the globe as a whole, illustrating the reality of “Arctic amplification”. We should note, however, that this is based on the unadjusted (“unhomogenized”) data from GHCN-M, so it’s the “raw” data without corrections for changes in station siting, instrumentation, or observing practices; read more here about the corrections that can be applied.
Looking at the last decade or so (see below), it’s remarkable to see the jump up that occurred in winter 2015-2016, when a “super El Niño” occurred; Arctic temperatures seem to have oscillated around a higher baseline since then. In the past 5 years, it has become fairly uncommon to have any station with a -5°C anomaly (even relative to the warmer 1991-2020 average), whereas most months in the past few years have had at least one site with a +5°C anomaly.
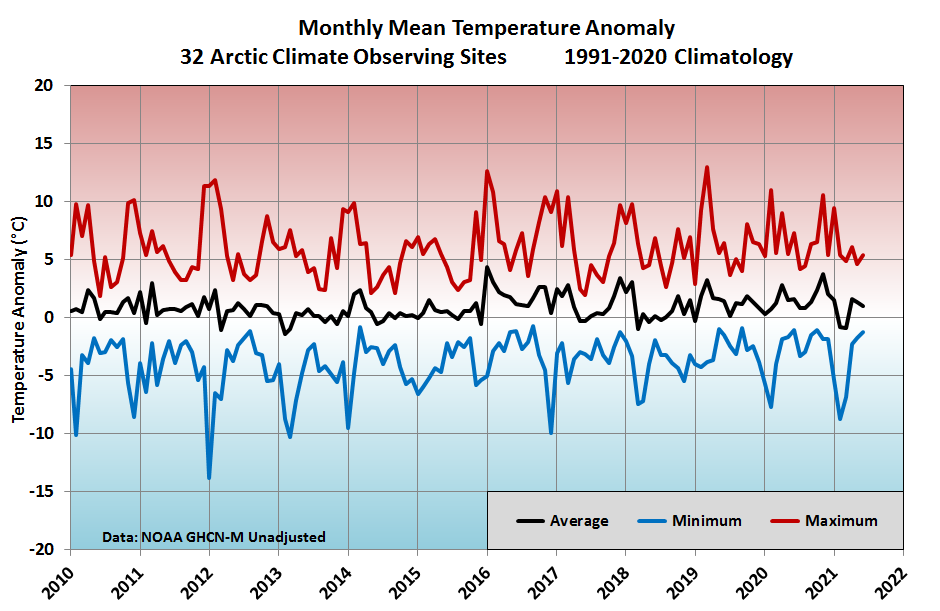
Interestingly, November of last year was the second warmest month in this period of record, with a +3.7°C average anomaly across the 32 sites. Only January 2016 was warmer, at +4.3°C. Again, this is relative to the new 1991-2020 baseline.
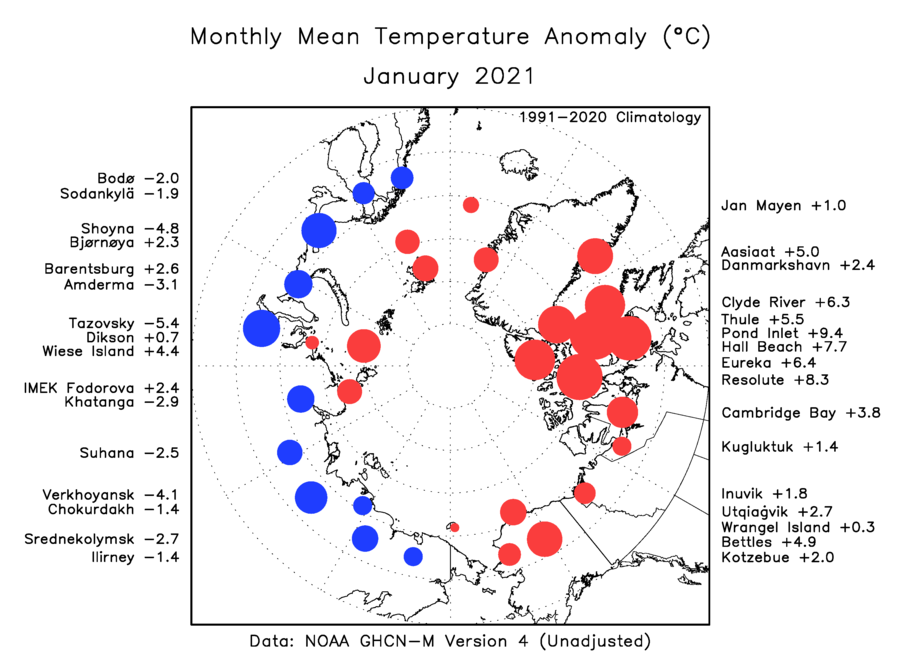
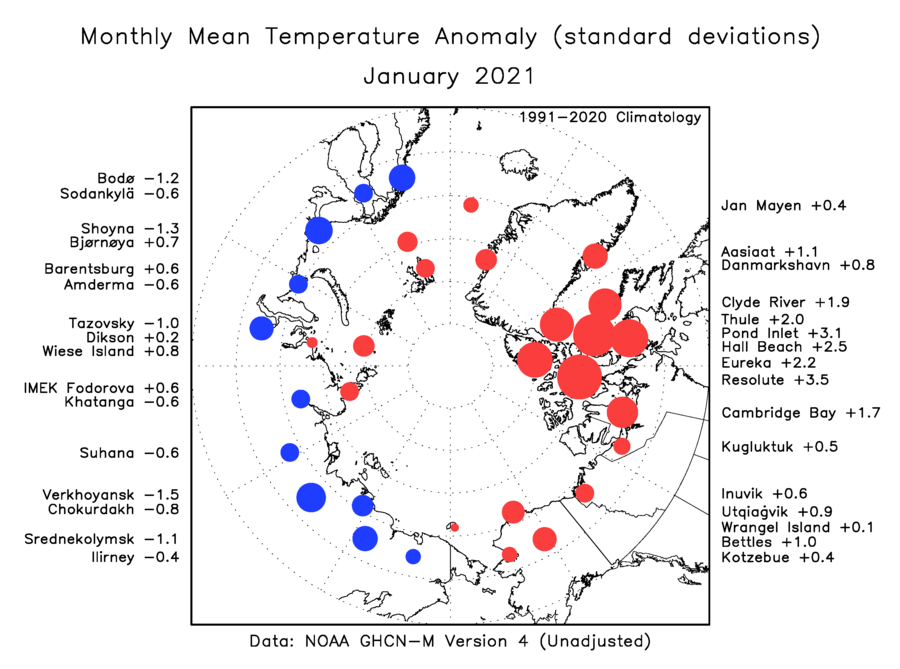
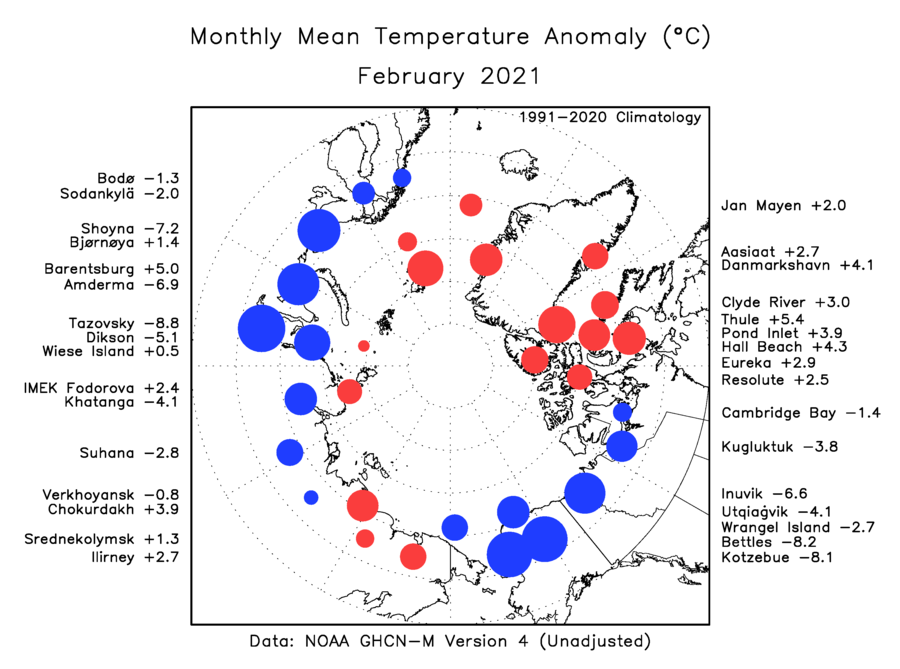
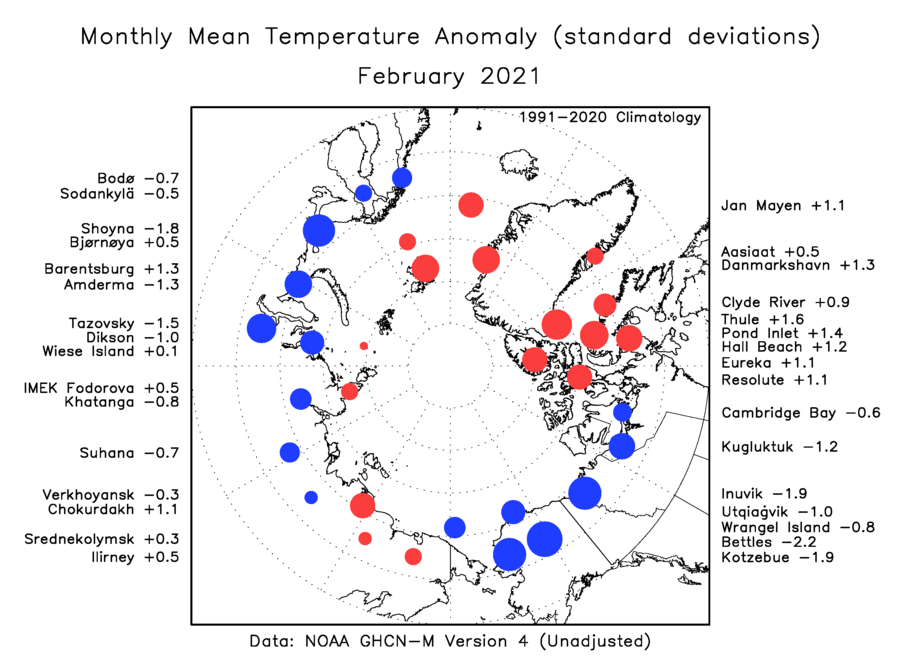
However, there was quite a drop-off in Arctic temperatures as last winter progressed, and both February and March were colder than the new normal. Below is a series of maps showing the monthly anomalies so far this year: there is a pair of maps for each year, with the first showing the departure from normal in absolute terms (degrees C), and the second showing the standardized anomaly (i.e. standard deviations above or below normal).
January 2021: note the excessive warmth in eastern Arctic Canada, with Resolute and Pond Inlet having their warmest January on record.
February 2021: one of a handful of months since 2016 in which one of the sites was more than 2 standard deviations below normal (in this case, it was Bettles, Alaska).
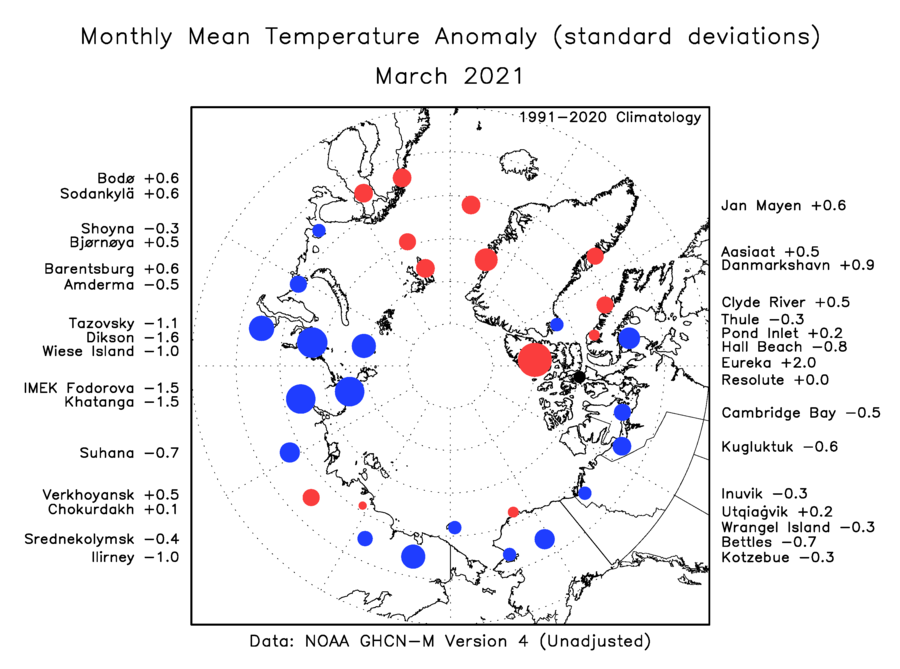
March 2021: notably colder than normal in north-central Siberia:

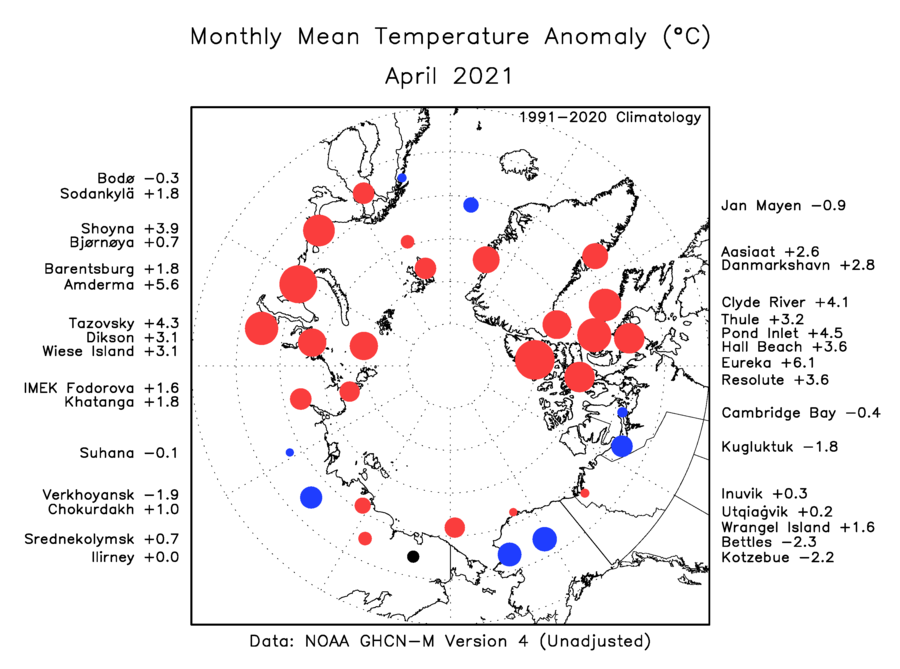
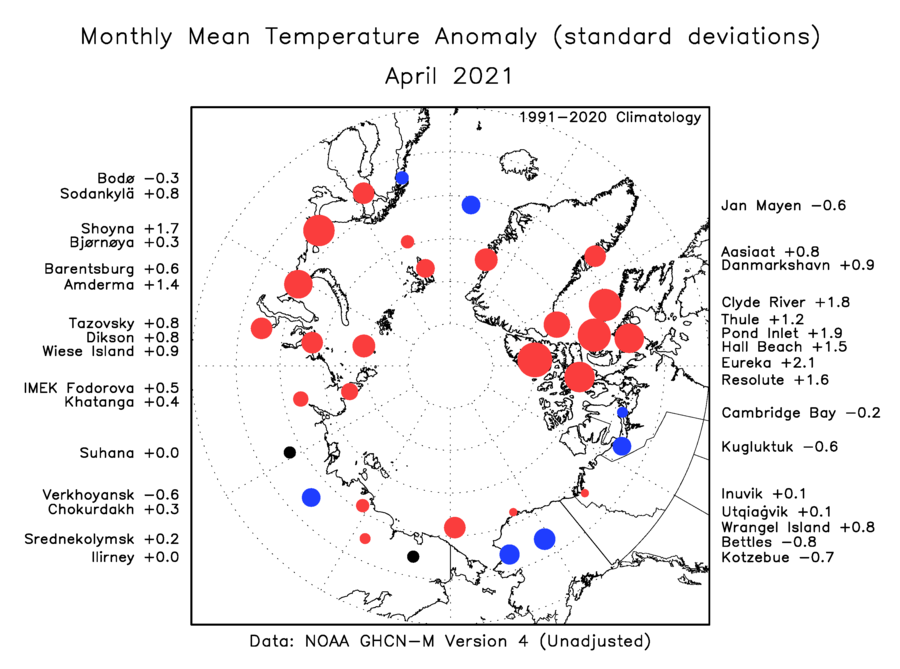
April 2021: a widespread return to warmth on the Atlantic side of the Arctic:
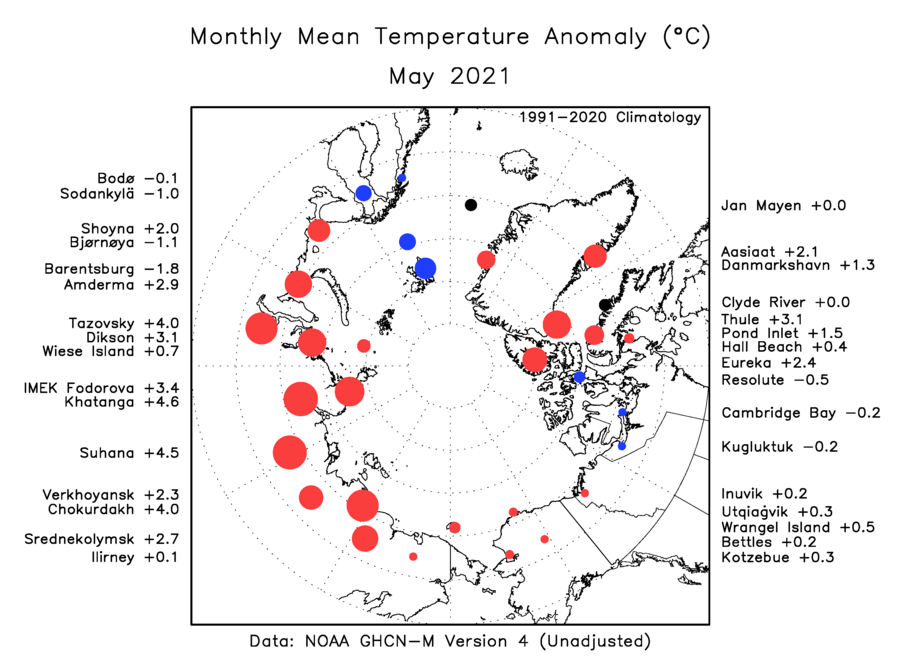
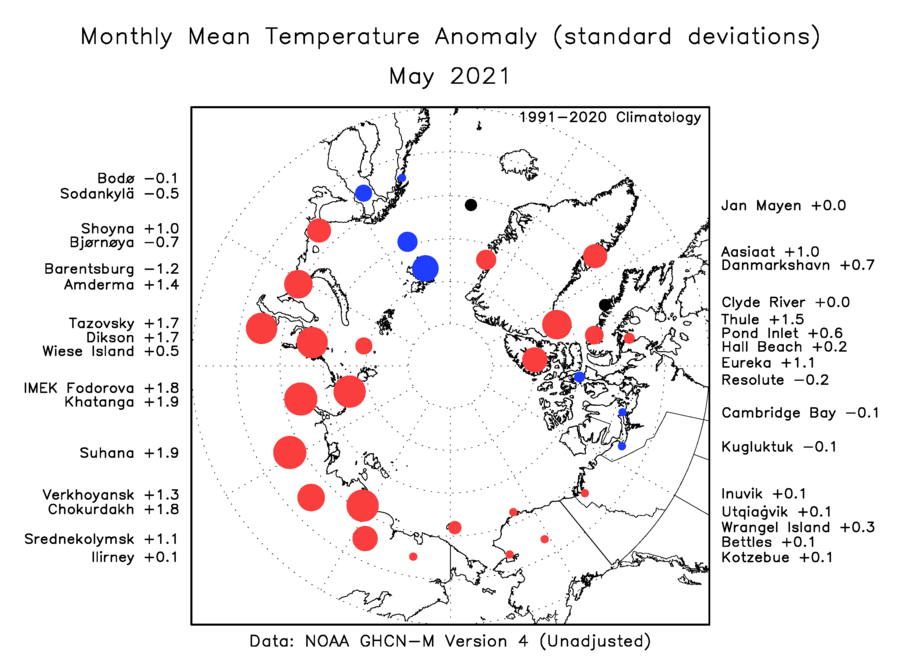
May 2021: unusual warmth across Arctic Russia, in a pattern reminiscent of the record-breaking warmth of 2020:
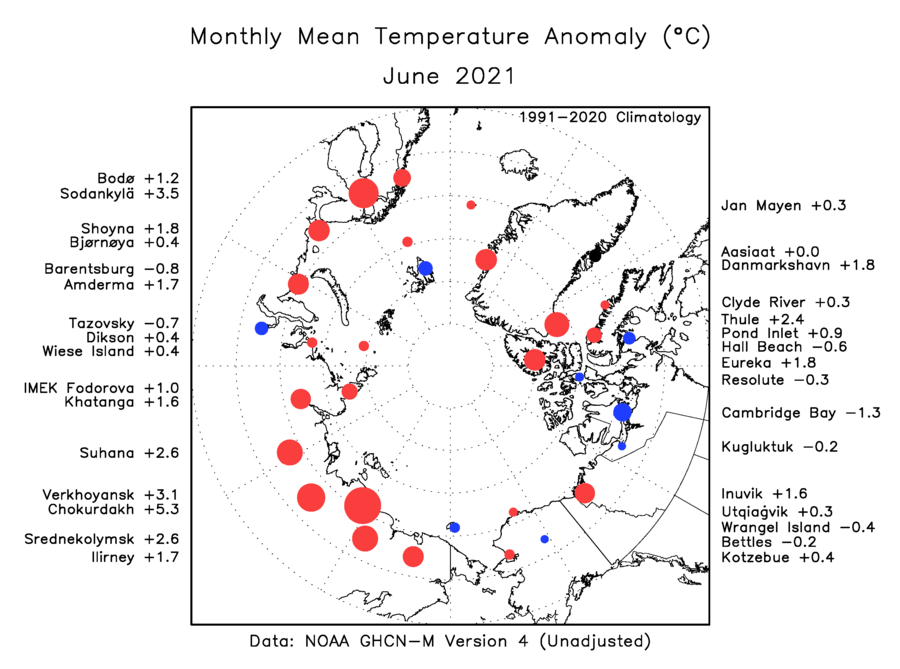
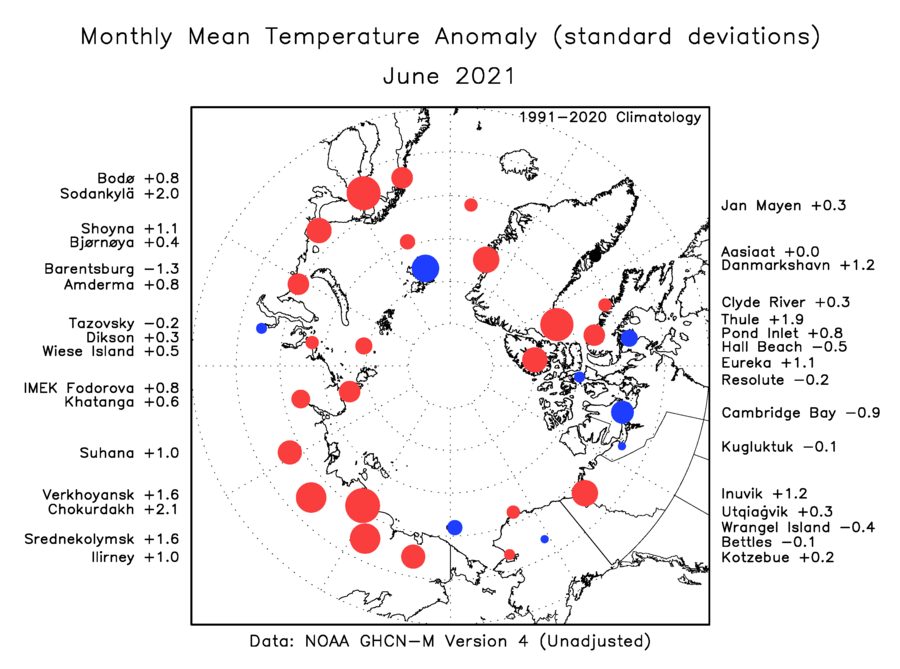
June 2021: significantly above-normal Arctic temperatures in several areas, but not everywhere:
In summary, the 32 Arctic climate observing sites identified here provide a good basis for ongoing monitoring of Arctic temperatures. The sites are fairly evenly distributed across the eastern and western Hemispheres, between the Atlantic and Pacific sides of the Arctic, and between coastal and inland locations; and all of them report reliably on a daily and monthly basis. Look for additional commentary and analysis from the World Climate Service in the months and years ahead.