Case Studies
Case Studies, Press Releases, and other material
-
Case Study: Energy Trading Meteorologist
- Case Study: WCS as an Early Warning System
-
Case Study: Long-range Forecasts for Australian Livestock Producers
-
Case Study: The UN FAO Case Study
Resources on our Blog
Published Papers and Book Chapters
Small Business Innovation Research Summary
Frequently Asked Questions
What forecast models are included in the World Climate Service?
The World Climate Service provides forecast information from the following dynamical models:
Seasonal Models
- European Centre for Medium-Range Weather Forecasts (ECMWF) SEAS5
- U.S. NOAA CFSv2
- Copernicus Climate Change Service (C3S) models including:
- UK Meteorological Office
- Japan Meteorological Agency (JMA) JMA/MRI-CPS2
Subseasonal Models
- ECMWF 46-Day Extended Ensemble
- NOAA GEFS
- NOAA CFSv2
- JMA GEPS
What is forecast calibration?
According to Tom Hamill, a research meteorologist at NOAA’s Earth System Research Lab and leader of their Attribution and Predictability Assessments team, forecast calibration is:
The statistical adjustment of ensemble weather forecasts with the goal of
- Inferring large-sample probabilities from small ensembles
- Removing bias and increasing forecast reliability while preserving as much sharpness as possible. This is guided by discrepancies between past observations and forecasts.
What does this mean?
Calibration is the process of comparing prior forecasts from the same forecast model (called reforecasts) to observed conditions to improve forecast performance. These improvements include both bias correction and – ideally – transformation of the forecast into a statistically reliable probabilistic framework. Bias correction finds and removes the average difference between the model forecasts and the observed (verification) data. Probabilistic forecasts provide information in terms of the probability of occurrence, which is an essential input for quantitative decision systems. A statistically reliable probabilistic forecast is one for which the predicted probability is – on average – equal to the observed frequency. For example, if a reliable forecast indicates that warmer than normal temperatures are 65% likely, then warmer than normal temperatures will occur 65% of the time when such a forecast is issued.
How does forecast calibration help me?
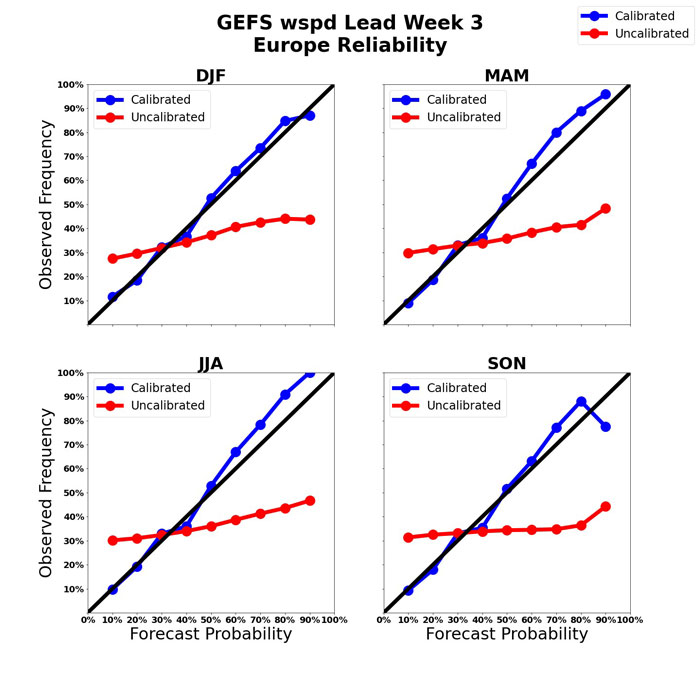
Forecast calibration enables World Climate Service users to assess the likelihood of specific outcomes that may positively or negatively impact your business. The graphics below are called “reliability diagrams” and measure how well the predicted probability corresponds to the frequency of predicted outcomes. The ideal result is a one-to-one relationship, shown in the graphic as the black line.
This graphic shows that calibrated forecasts are far superior to uncalibrated (“raw ensemble”) forecasts in predicting the frequency of occurrence (in this case for above-normal wind speeds over Europe at a 3 week lead time).
What is a forecast of opportunity?
A “forecast of opportunity” is a forecast that has an unusually high probability. An unusual opportunity exists because the forecast is substantially more likely to be correct than is typical under similar circumstances (i.e. similar lead time, location, and time of year). Because WCS probability forecasts are calibrated, the user can assess the risk of specific actions with accurate knowledge of the chance of success or failure, and therefore a high probability corresponds to a high chance of success, i.e. “opportunity”.
How many forecast methodologies does the World Climate Service provide?
The World Climate Service allows users to compare climate forecast information from three independent information sources. These are:
- Calibrated dynamical forecasts
- Analog forecasts
- Statistical forecasts
Providing three sets of forecasts allows users to explore the risks and develop a confidence estimate of their forecast based on comparing the three types of information.
How can I determine the impacts of climate indices on surface conditions?
It is challenging to keep track of the impact of many different climate phenomena on weekly, monthly, and seasonal climate in different locations and times of the year. The World Climate Service provides index analog impact estimates for a wide range of variables. The flexibility of our analysis tools enables customers to specify not only customized target time frames but also index combinations. WCS users rely on our efficient and intuitive interface to query the historical data, translate the information into surface climate analysis, and facilitate understanding of the likely impacts of the climate indices.
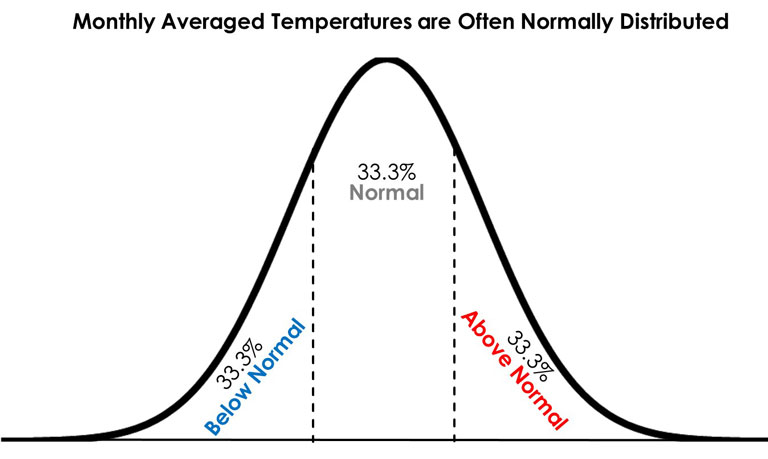
What is a tercile forecast?
Daily weather data averaged over more extended periods such as weeks or months is often categorized in terms of climate terciles, i.e. three equal divisions of the climate: below-normal, near-normal, and above-normal. Long-range forecasts are traditionally presented in terms of the probability of each tercile, and these forecasts are known as tercile forecasts. The World Climate Service often follows this method. Note that terciles can be defined for any distribution of the climate, whether normal (“Gaussian”) or not; for a normal distribution, the tercile categories are defined as below.
What is a long-range forecast?
What is forecast reliability?
Discover how World Climate Service can be your primary source for reliable climate forecasting
